How much does a price change move grocery demand?
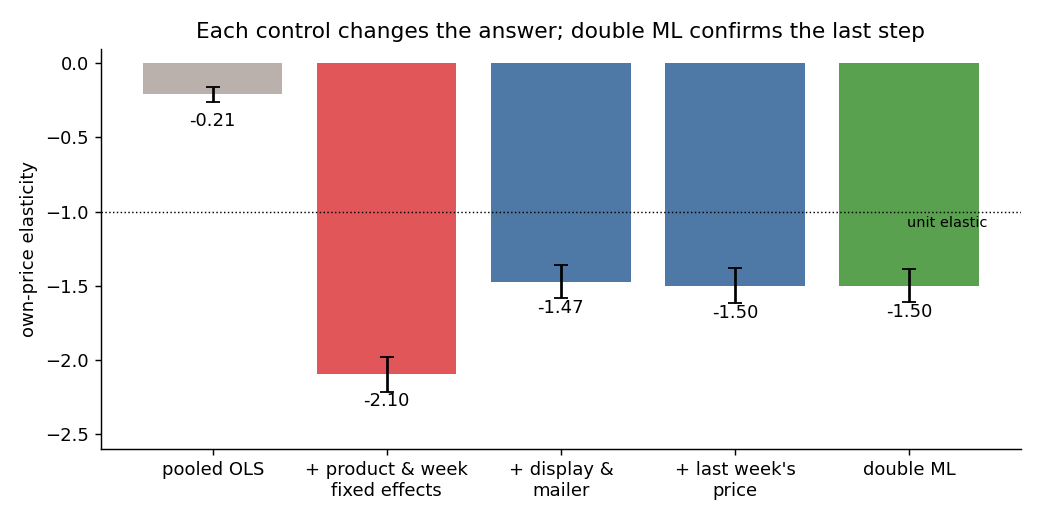
Two years of real purchases from 2,500 households, 580 packaged products, with loyalty discounts, in-store displays and mailers. Prices do not move at random: sales coincide with promotions and shoppers stock up. Removing those biases one at a time answers when a discount pays for itself.
-1.50own-price elasticity, double ML
40%overstatement if promotions are ignored (-2.10)
+0.11last week's discount lowers this week's sales
50%+gross margin needed for a 10% cut to pay, even for beer
01Each control changes the answer
02Categories differ, and discounts rarely pay on their own
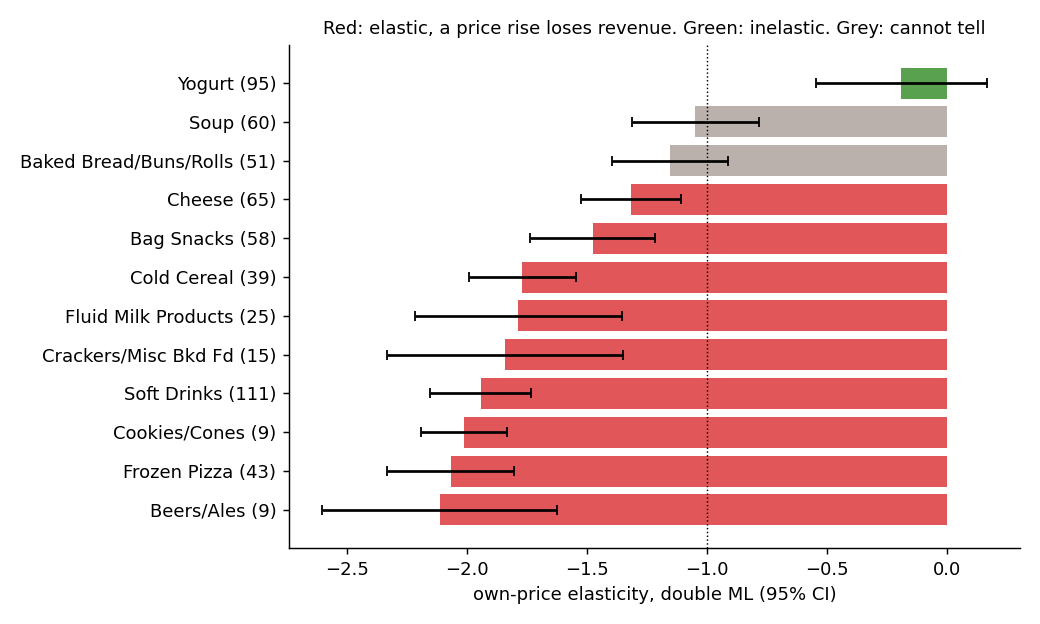
A 10% discount raises profit on the product itself only above a break-even gross margin: 50% for beer, 54% for soft drinks, 87% for bread, 96% for soup, and never for yogurt. Discounts that make sense earn their keep through traffic, basket size or supplier funding, which a product-level elasticity does not measure.