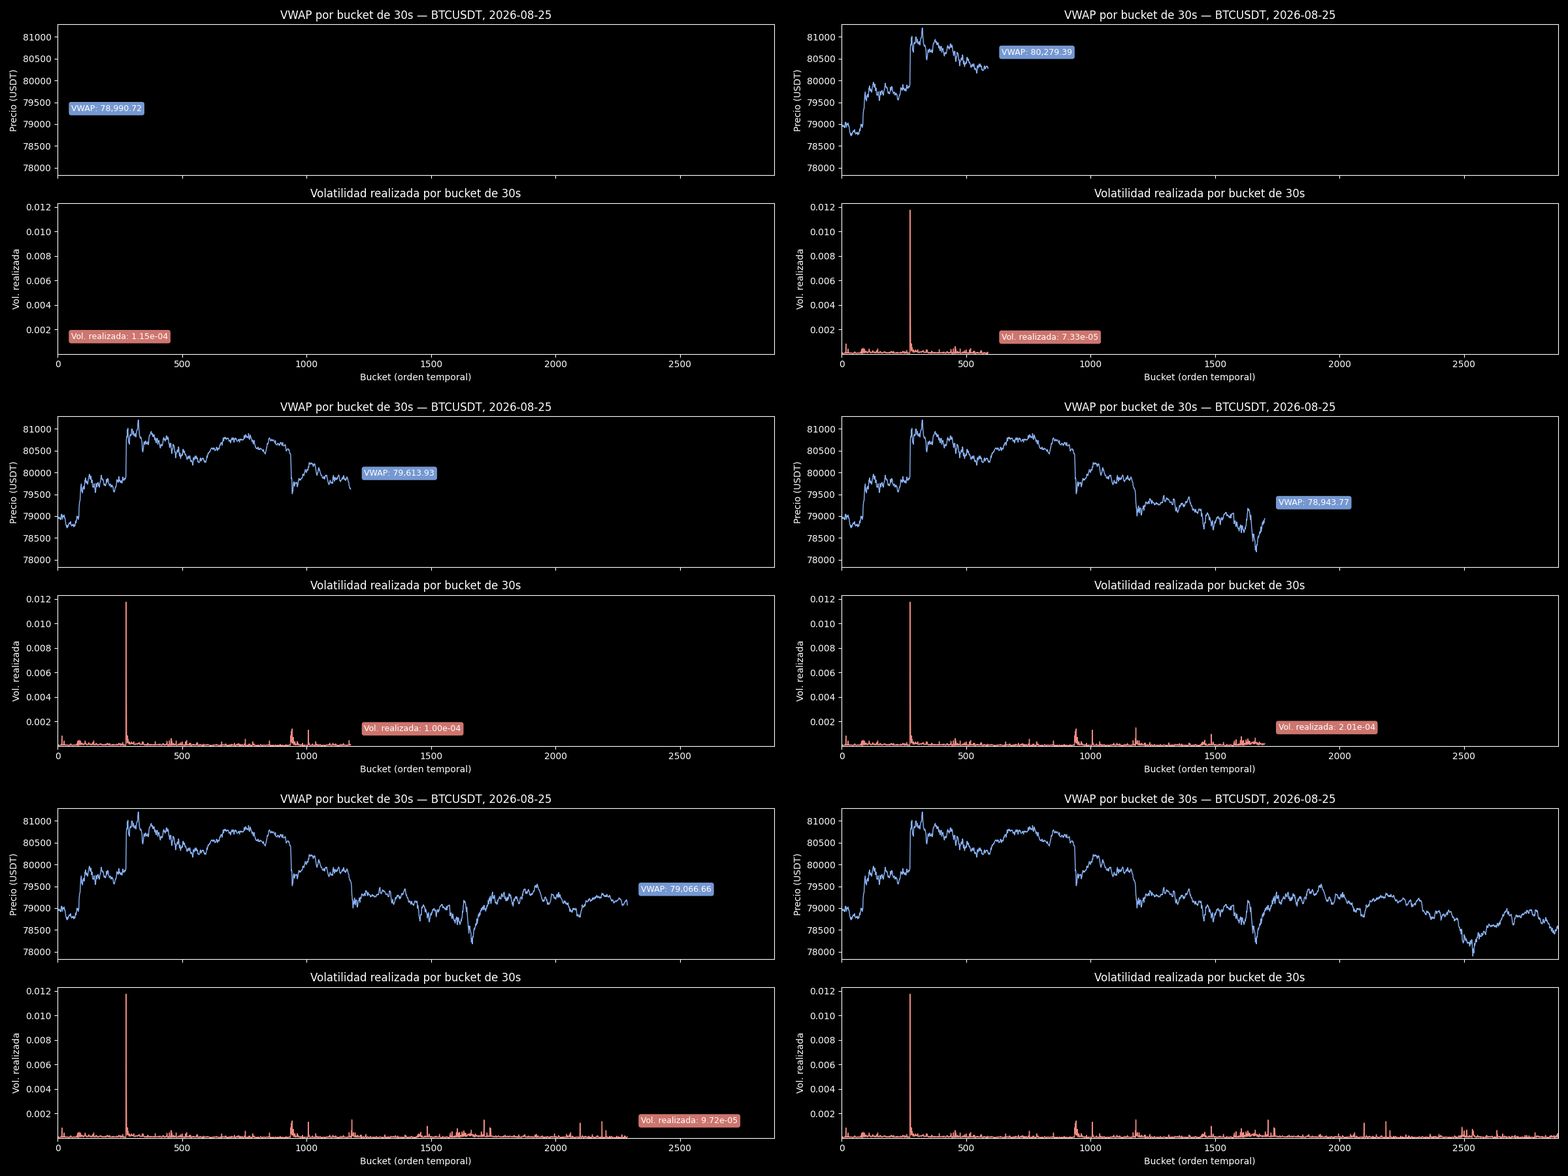
Reading Market Turbulence
Forecasts short-horizon realized volatility from real crypto order-flow — 24.8 million real trades, BTCUSDT + ETHUSDT, 10 full days each, downloaded directly from Binance's public historical data archive (no API key, no synthetic data anywhere).
This page shows the project's results. The methodology, the design decisions and the limitations are documented in the repository's README.
Task
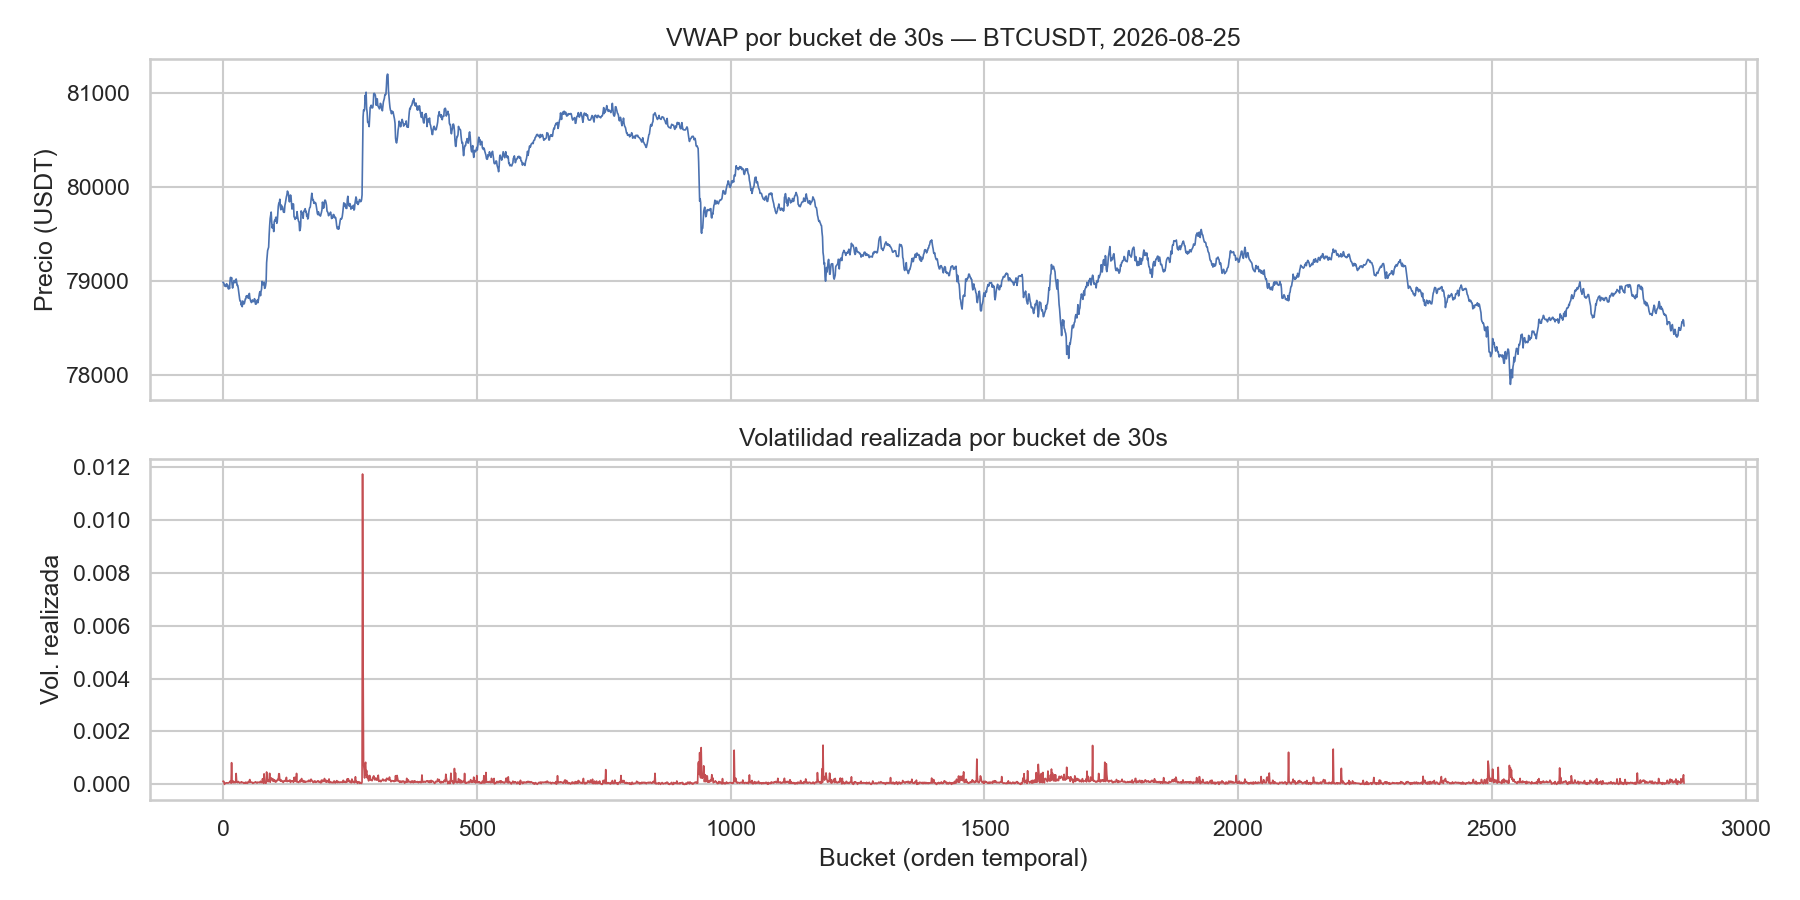
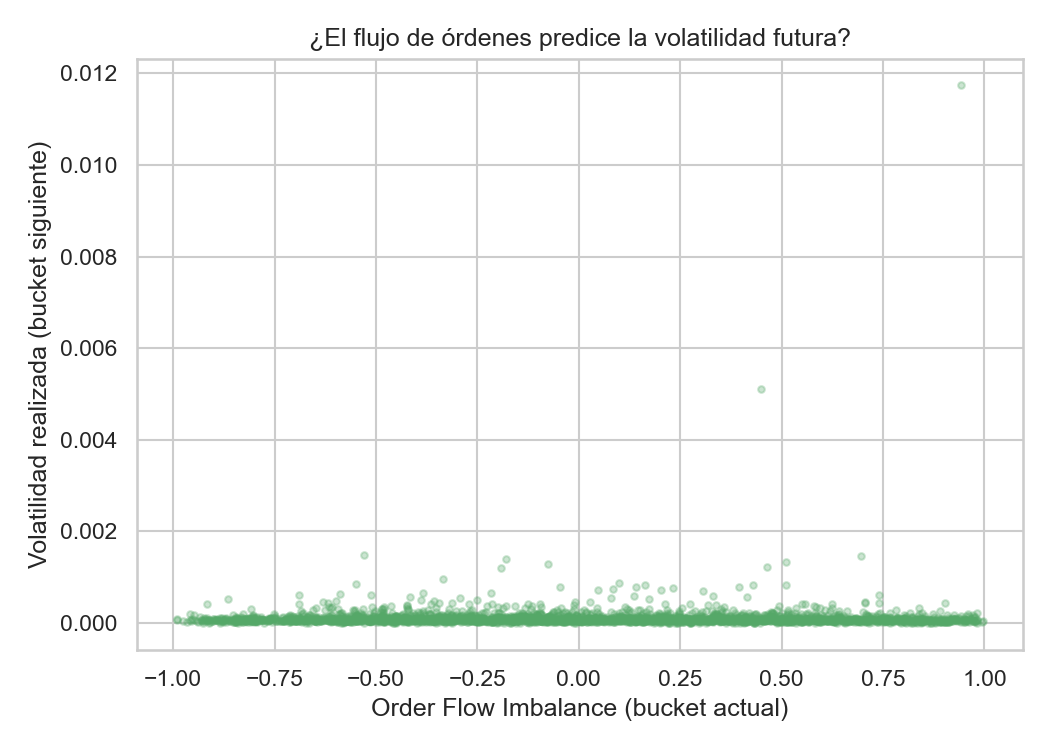
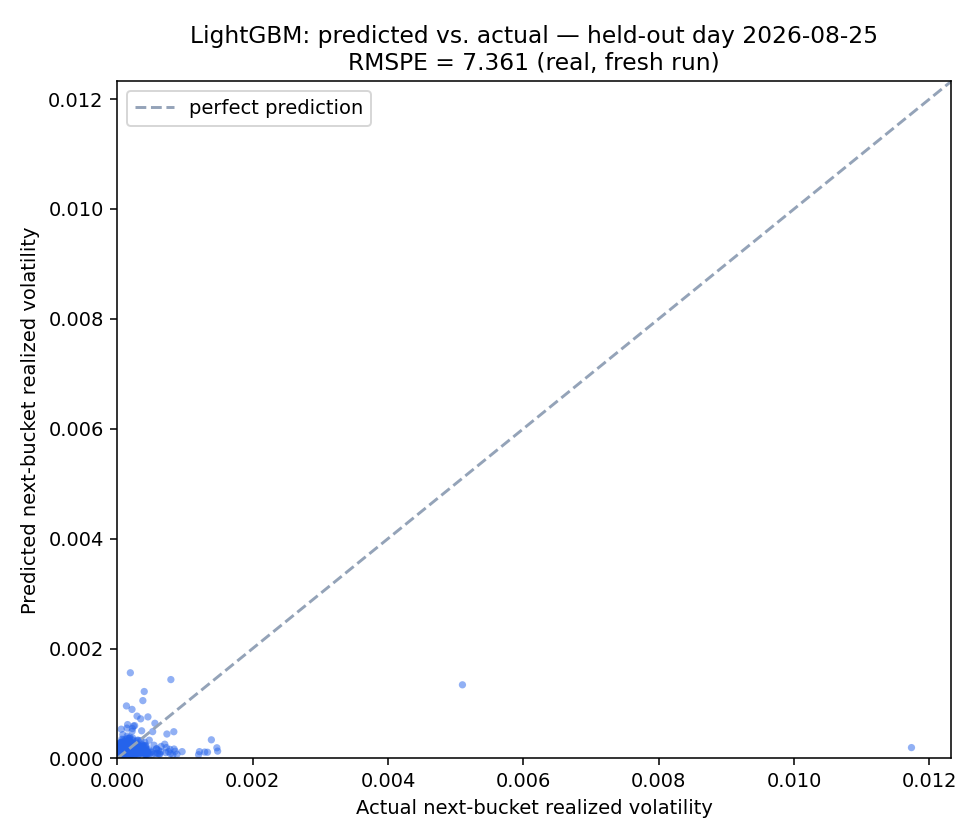
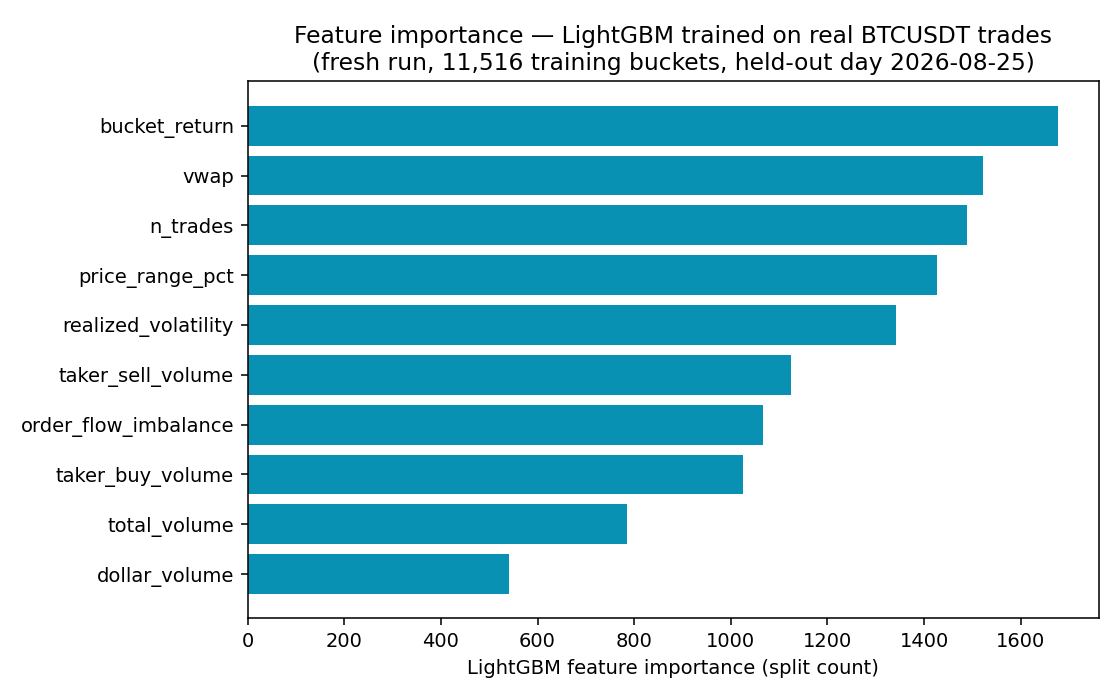
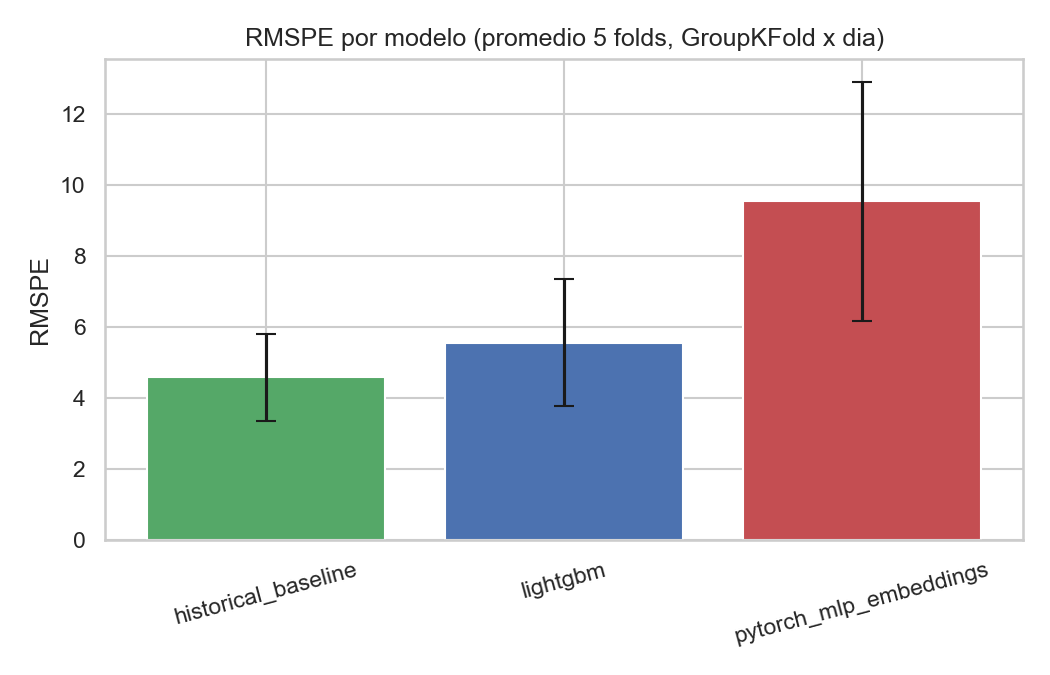
Results (real run, GroupKFold across 5 real trading days)
Activation comparison with a custom loss (PyTorch)
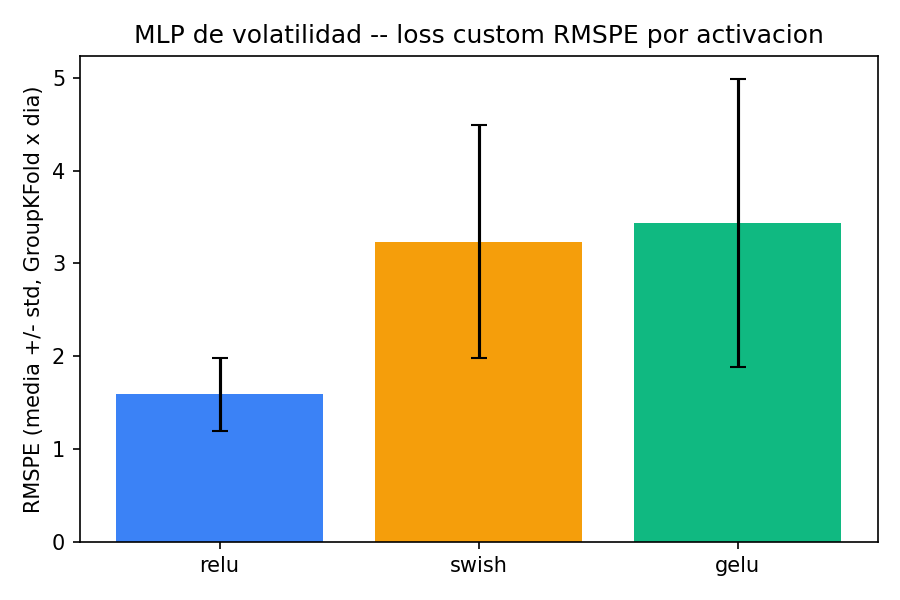
Fresh confirmation run (real data, re-executed today)