What a late delivery costs a marketplace
96,470 real orders from Olist, a Brazilian marketplace. Late orders get 2 points lower reviews on a 1-5 scale. The question is how much of that gap the delay itself causes, whether it can be seen coming at checkout, and whether it costs the customer too.
01The delay, not the order, drives the score
| Estimator | Effect on review score |
|---|---|
| Naive difference | -2.02 |
| OLS with purchase-time covariates | -1.98 |
| Inverse propensity weighting | -1.97 |
| AIPW, cross-fitted LightGBM | -1.97 (95% CI -2.02 to -1.93) |
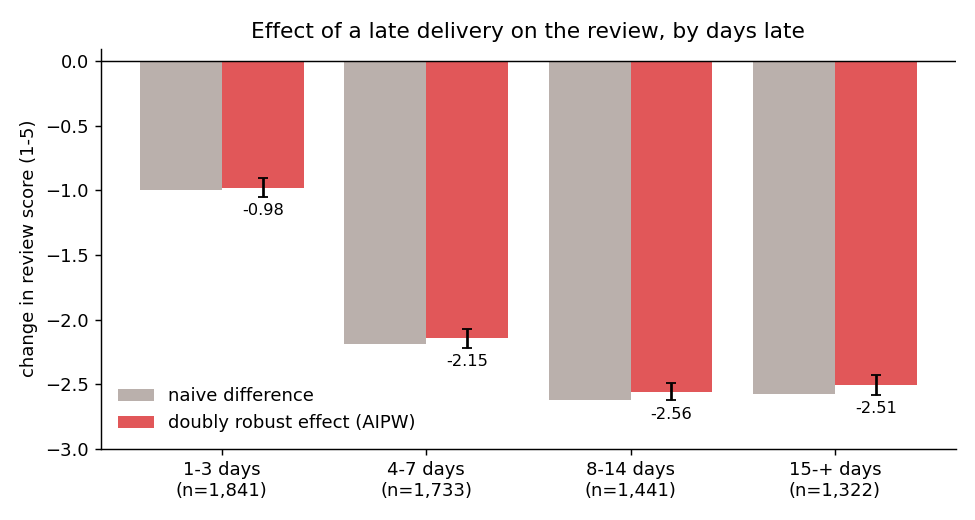
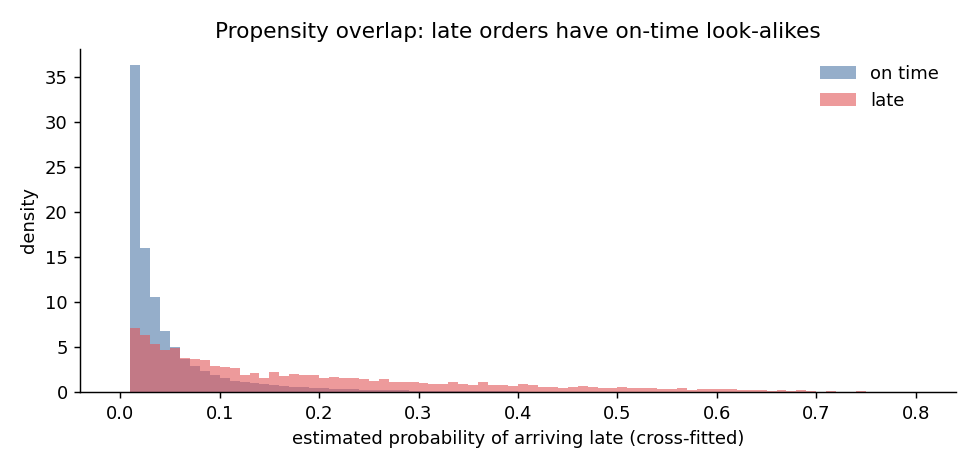
Adjusting for distance, states, items, price, category and purchase date barely moves the estimate. A hidden confounder would need to explain 27% of the residual variance of both lateness and score to erase it; the strongest observed one explains about 1%.
02The cleaning step that would have biased everything
Olist sends its survey when the parcel arrives or when the promised date passes. For late orders the survey usually comes first: 74% of them were reviewed before delivery, by customers who already knew. Dropping pre-delivery reviews, the obvious cleanup, would keep only a quarter of the late orders and none more than 8 days late.
03Seeing delays coming
04Does it cost the customer?
Only 3% of Olist customers ever buy again. After a late first order, 2.6% returned within 180 days against 3.1% after an on-time one, but the adjusted effect (-0.4 points, 95% CI -1.0 to +0.2) and the Cox hazard ratio (0.90, CI 0.78-1.03) cannot rule out zero. Effects under about one percentage point are beyond what this data can detect.