What moves a streaming anomaly-detection score?

58 real and artificial sensor and server series from the Numenta Anomaly Benchmark, scored with a rule built for monitoring: detect online, detect early, and pay for every false alarm. A validated scorer, simple detectors, and an honest number.

9 / 9published NAB results reproduced exactly by the scorer
2.4 → 41.0seasonal detector once it reports only onsets
42.4cross-validated score (49.5 tuned in-sample)
27.1on the known-cause series, the weakest category

01Where it lands
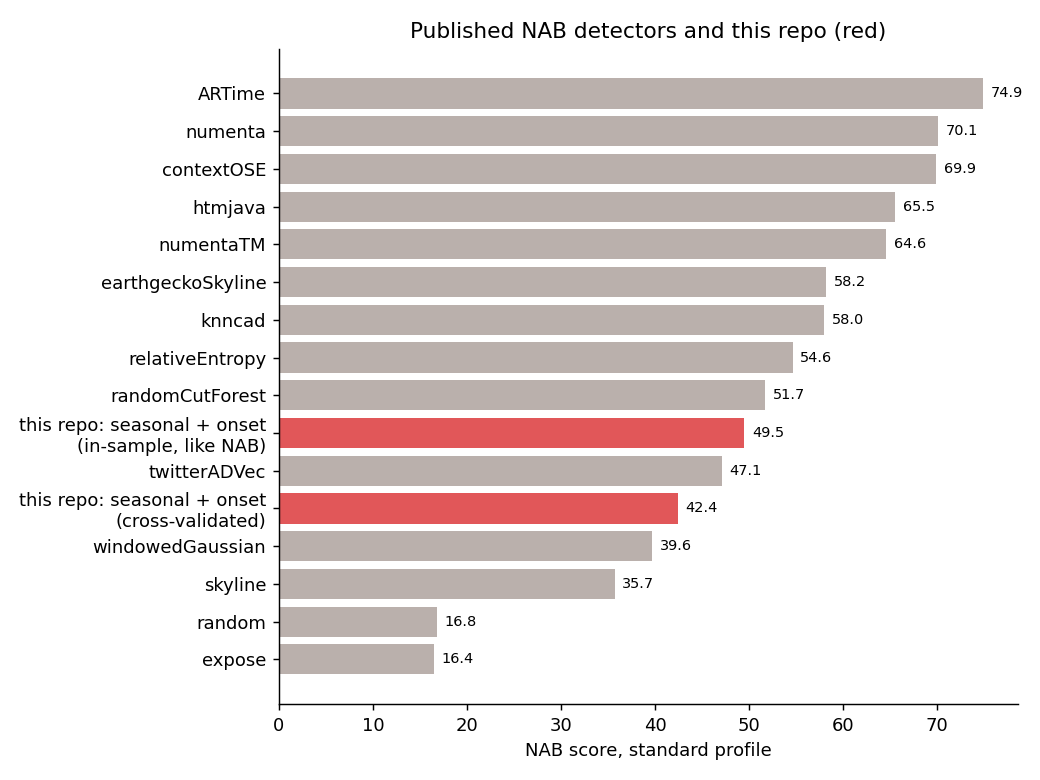
Horizontal bar chart of NAB standard scores: published detectors from expose 16.4 to ARTime 74.9, with this repo at 49.5 in-sample and 42.4 cross-validated, both above windowedGaussian 39.6.
Published detectors (grey) and this repo (red). The cross-validated score chooses settings and threshold without the data it scores; most published numbers do not.

02Reporting onsets, not the detector, makes the difference
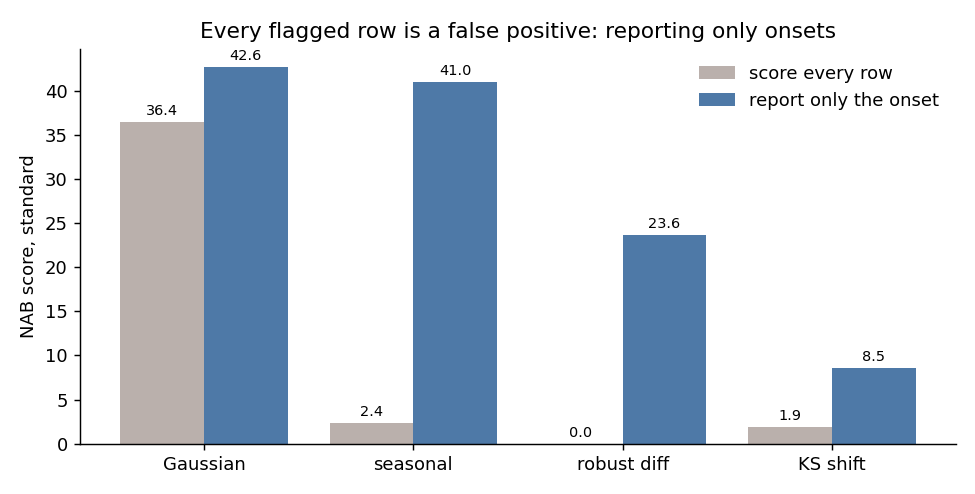
Paired bars per detector, score every row versus report only the onset: Gaussian 36.4 to 42.6, seasonal 2.4 to 41.0, robust diff 0 to 23.6, KS shift 1.9 to 8.5.
NAB charges every flagged row outside a window. Reporting only the start of each excursion, without look-ahead, turns useless detectors into competitive ones.

03One threshold does not fit every machine
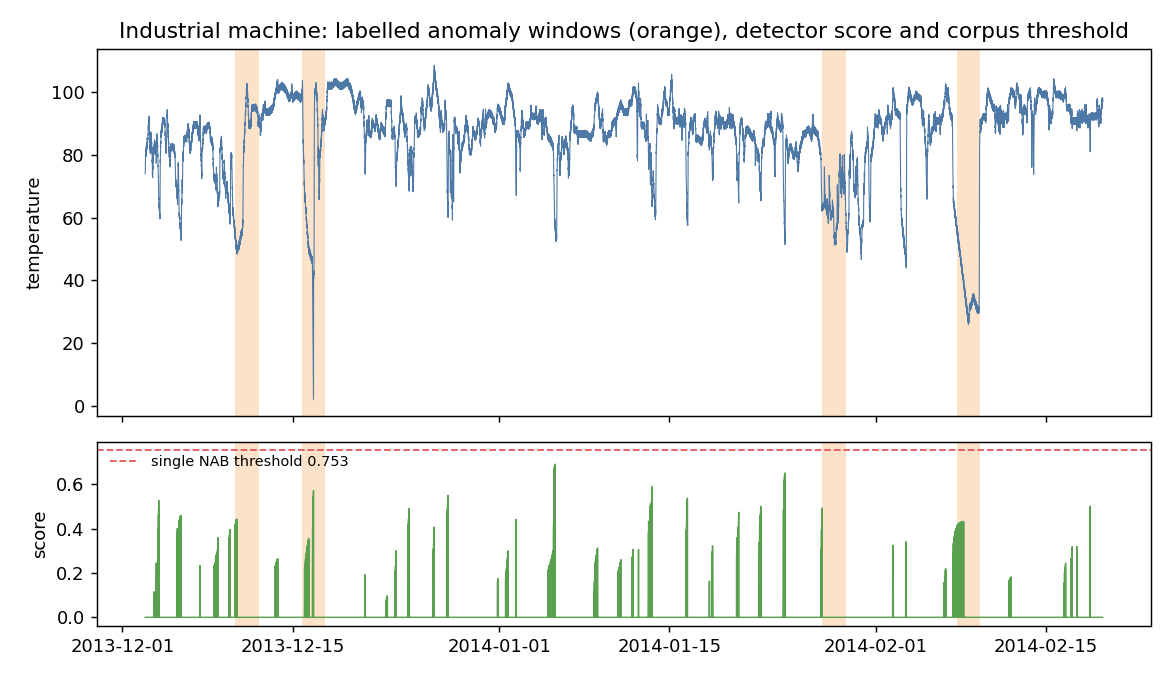
Machine temperature series with four labelled anomaly windows and the detector score below; the score rises inside three windows to about 0.4-0.6, but the corpus threshold of 0.753 is above every value.
The detector reacts inside three of four windows on a real industrial failure, but the single corpus-wide threshold is set by the other 57 series and flags nothing here.