A readmission model a hospital could actually use

99,340 real encounters of diabetic patients in 130 US hospitals, 11.4% readmitted within 30 days. Making the model look good is easy: one leaky feature lifts AUC to 0.80. Making it useful means honest validation, calibrated risks, a net benefit at realistic thresholds, and checking who it fails.

0.671honest AUC on held-out patients (0.805 with the leak)
2.4xreadmission rate among patients flagged at 20% risk
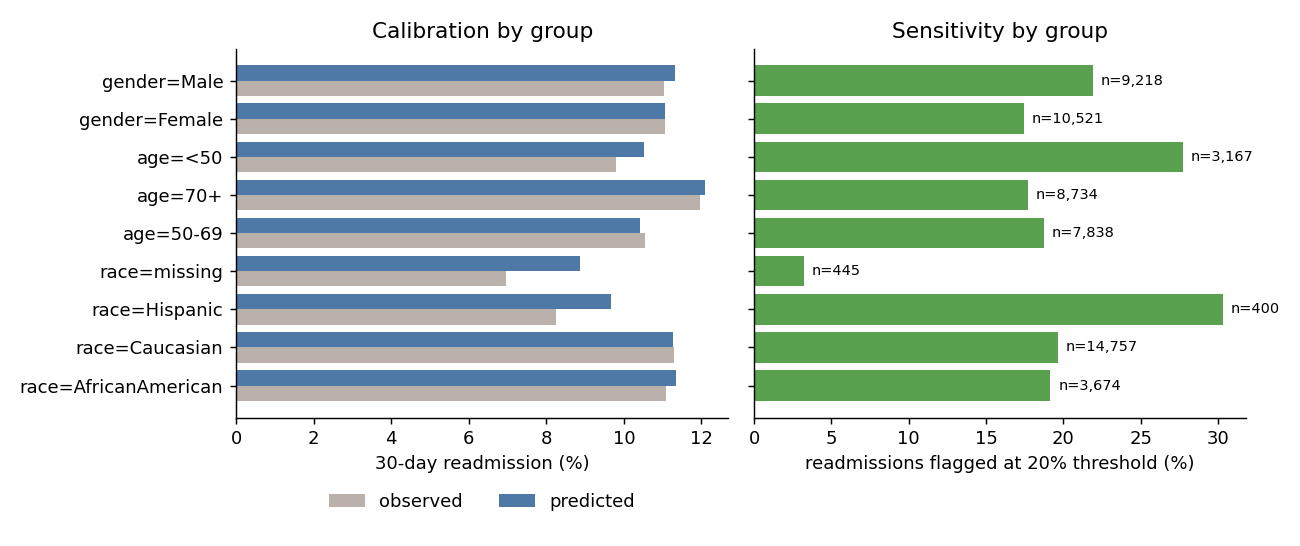
19% / 20%readmissions flagged, African American / Caucasian
3%flagged when race is not recorded: a blind spot

01The leak worth 0.12 AUC
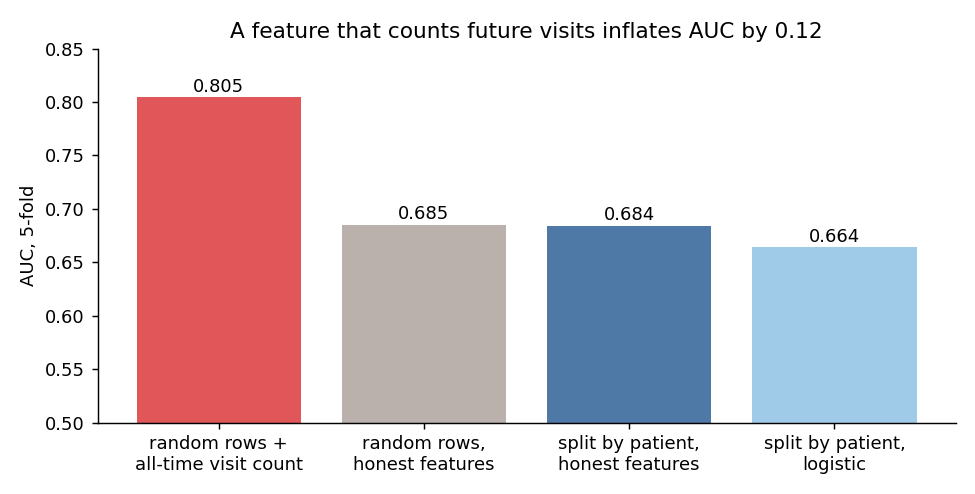
Bar chart of 5-fold AUC: 0.805 with an all-time visit count, 0.685 with random rows and honest features, 0.684 split by patient, 0.664 for logistic regression.
A 30-day readmission is itself another visit, so counting a patient's visits over the whole dataset encodes the answer. Counting only earlier visits is what a hospital knows at discharge. Splitting by patient instead of by row barely changes the score here.

02Calibrated, and better than the simple policies
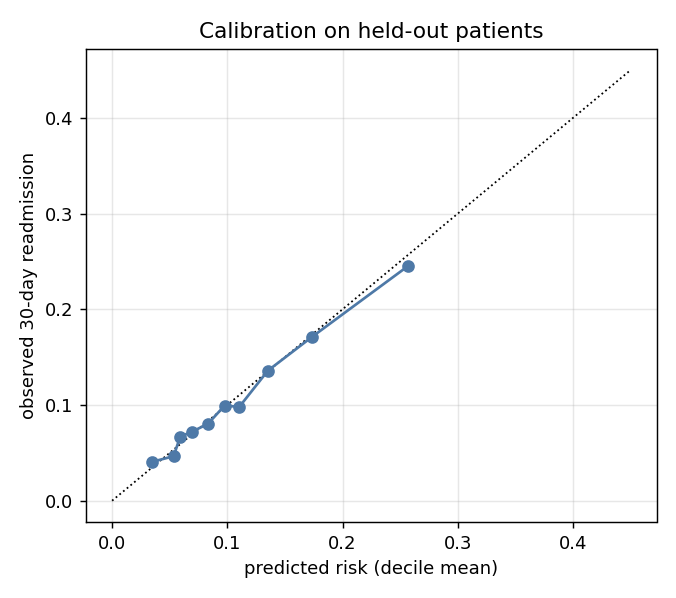
Calibration plot of observed readmission against predicted risk by decile; points lie close to the diagonal.
Predicted risk tracks observed readmission across deciles on held-out patients.
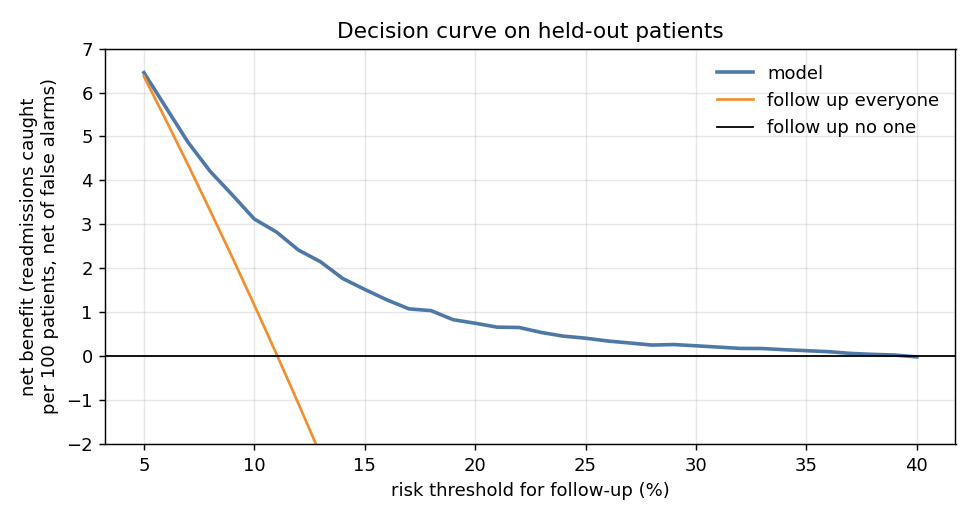
Decision curve: the model net benefit stays above both following up everyone and no one from a 5% to a 39% risk threshold.
Net benefit in readmissions caught per 100 patients, net of false alarms. At a 10% threshold the model gives 3.1 against 1.2 for following up everyone, and it stays positive up to 39%.

03Who the model serves worse

Two panels by group: observed vs predicted readmission rates, which match closely for large groups, and the share of readmissions flagged, which is lowest for patients with missing race at about 3%.
No gap between African American and Caucasian patients. Patients 70+ are separated less well (AUC 0.64 vs 0.72 under 50), and patients with no recorded race are both over-predicted and almost never flagged.