Crypto Quant Techniques Lab
A single lab, eight standalone techniques applied to crypto market data — signal detection, market microstructure, portfolio construction, and NLP. Each technique lives in its own numbered folder with its own README, requirements, and tests, and can be run independently. This repo replaces eight separate single-technique repos that used to live on this profile; consolidating them here makes the actual point clearer: these are variations on a shared toolkit (statistical arbitrage, anomaly detection, supervised/unsupervised ML), not eight unrelated projects.
This page shows the project's results. The methodology, the design decisions and the limitations are documented in the repository's README.
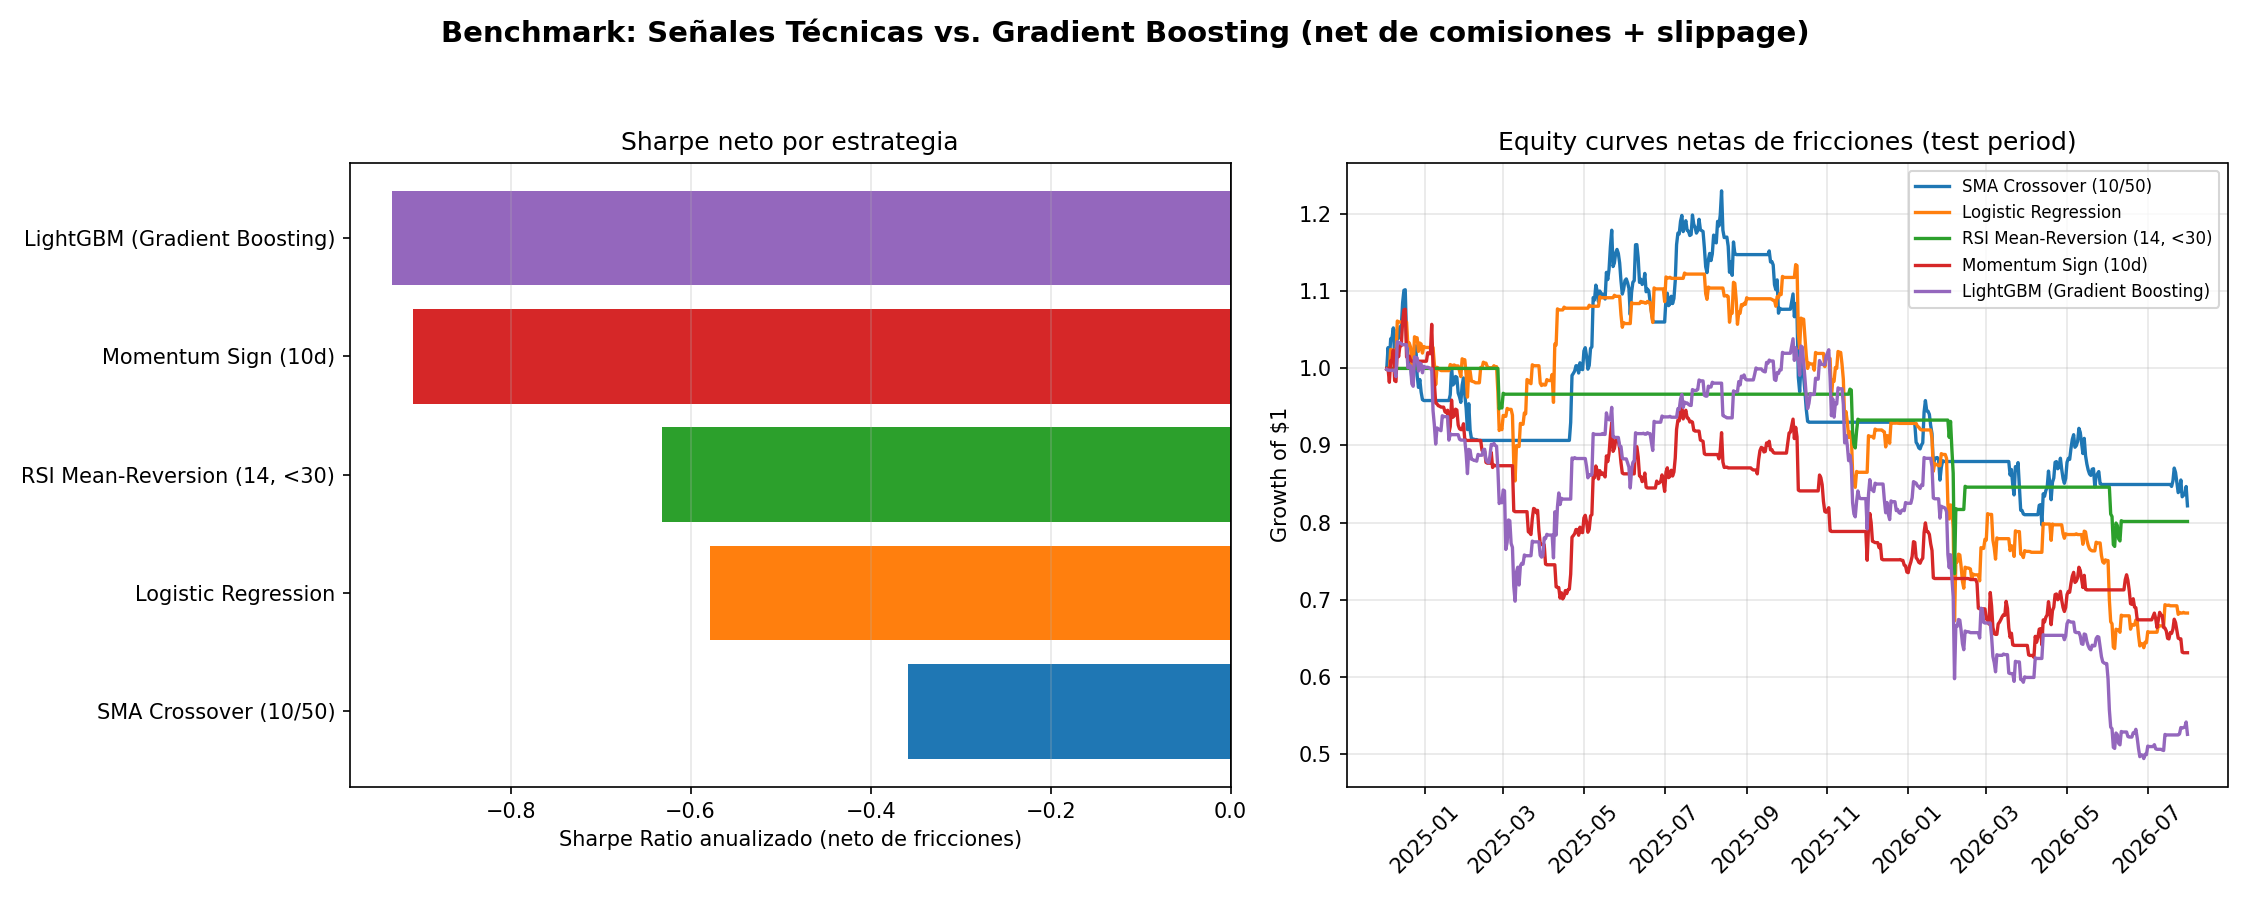
Five strategies, five negative Sharpes, and the simplest one wins
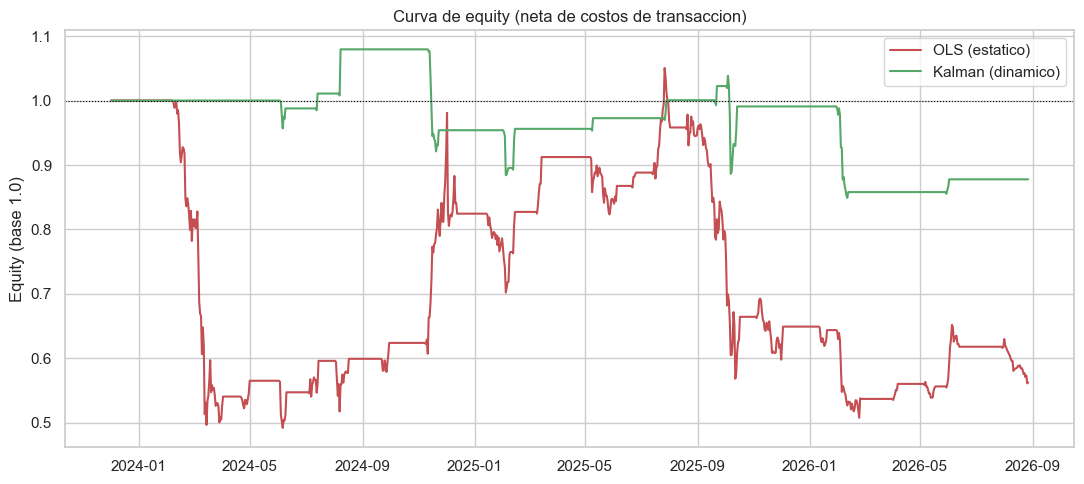
An improvement that is still a loss
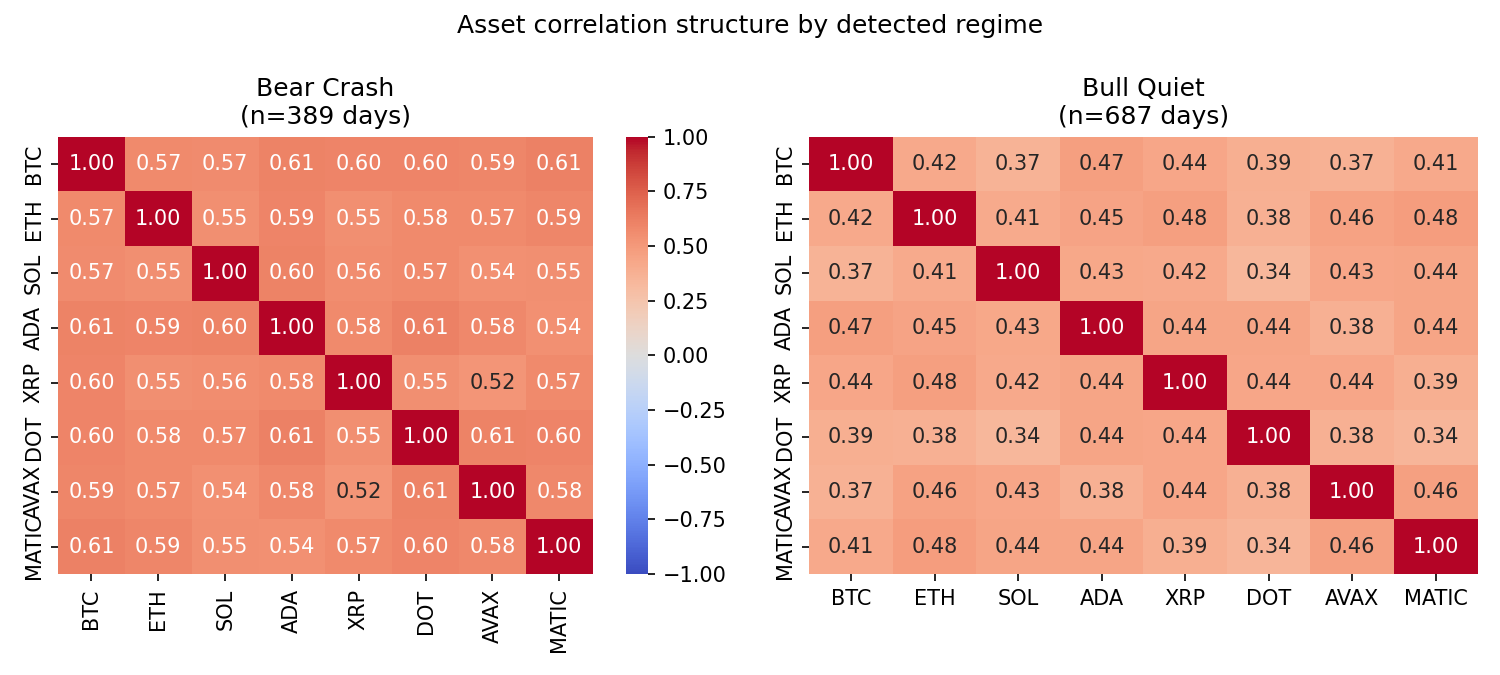
Diversification collapses when it is needed