🚚 Chile Spatial Logistics Optimizer
Geospatial intelligence system for Dark Store siting and last-mile delivery route optimization in Santiago, Chile's Metropolitan Region.
This page shows the project's results. The methodology, the design decisions and the limitations are documented in the repository's README.
6.1 Demand forecasting (Phase 3) -- model comparison
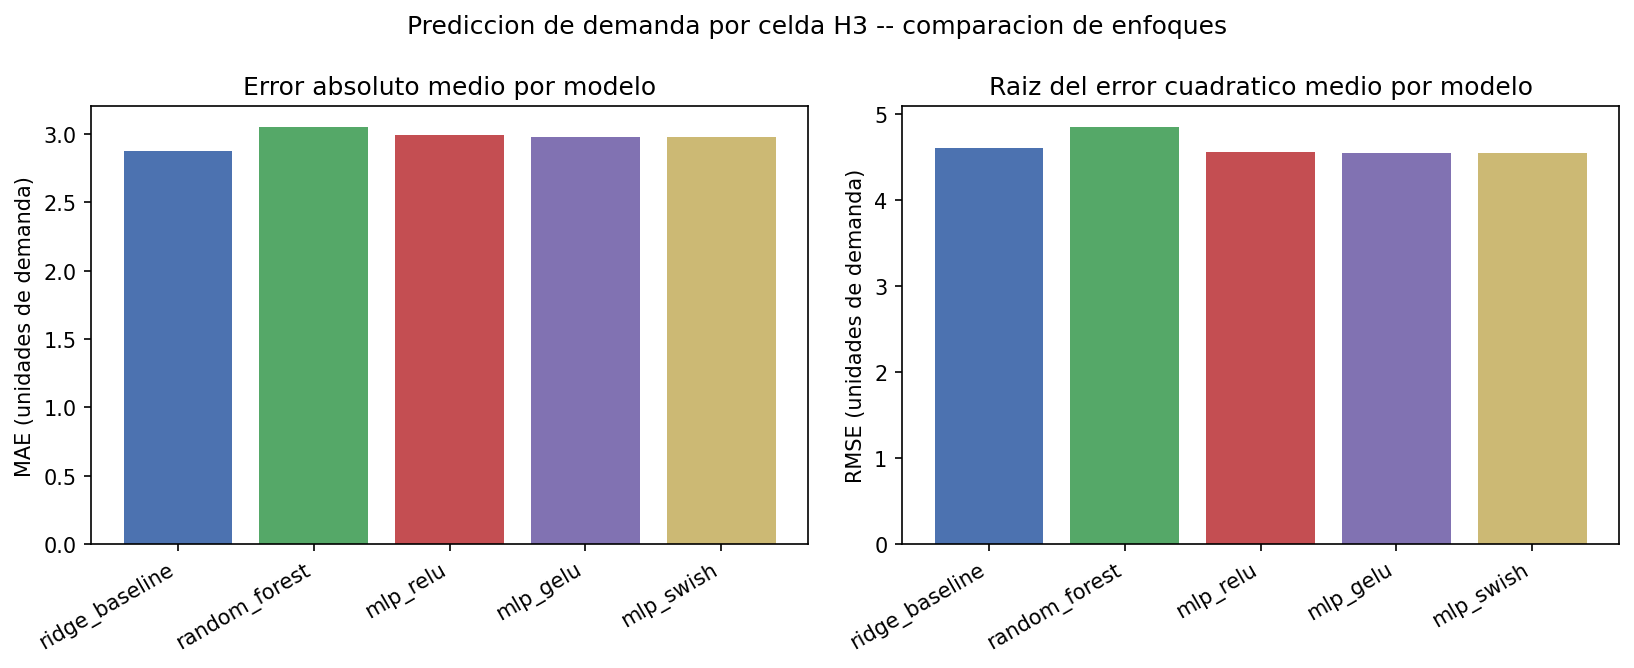
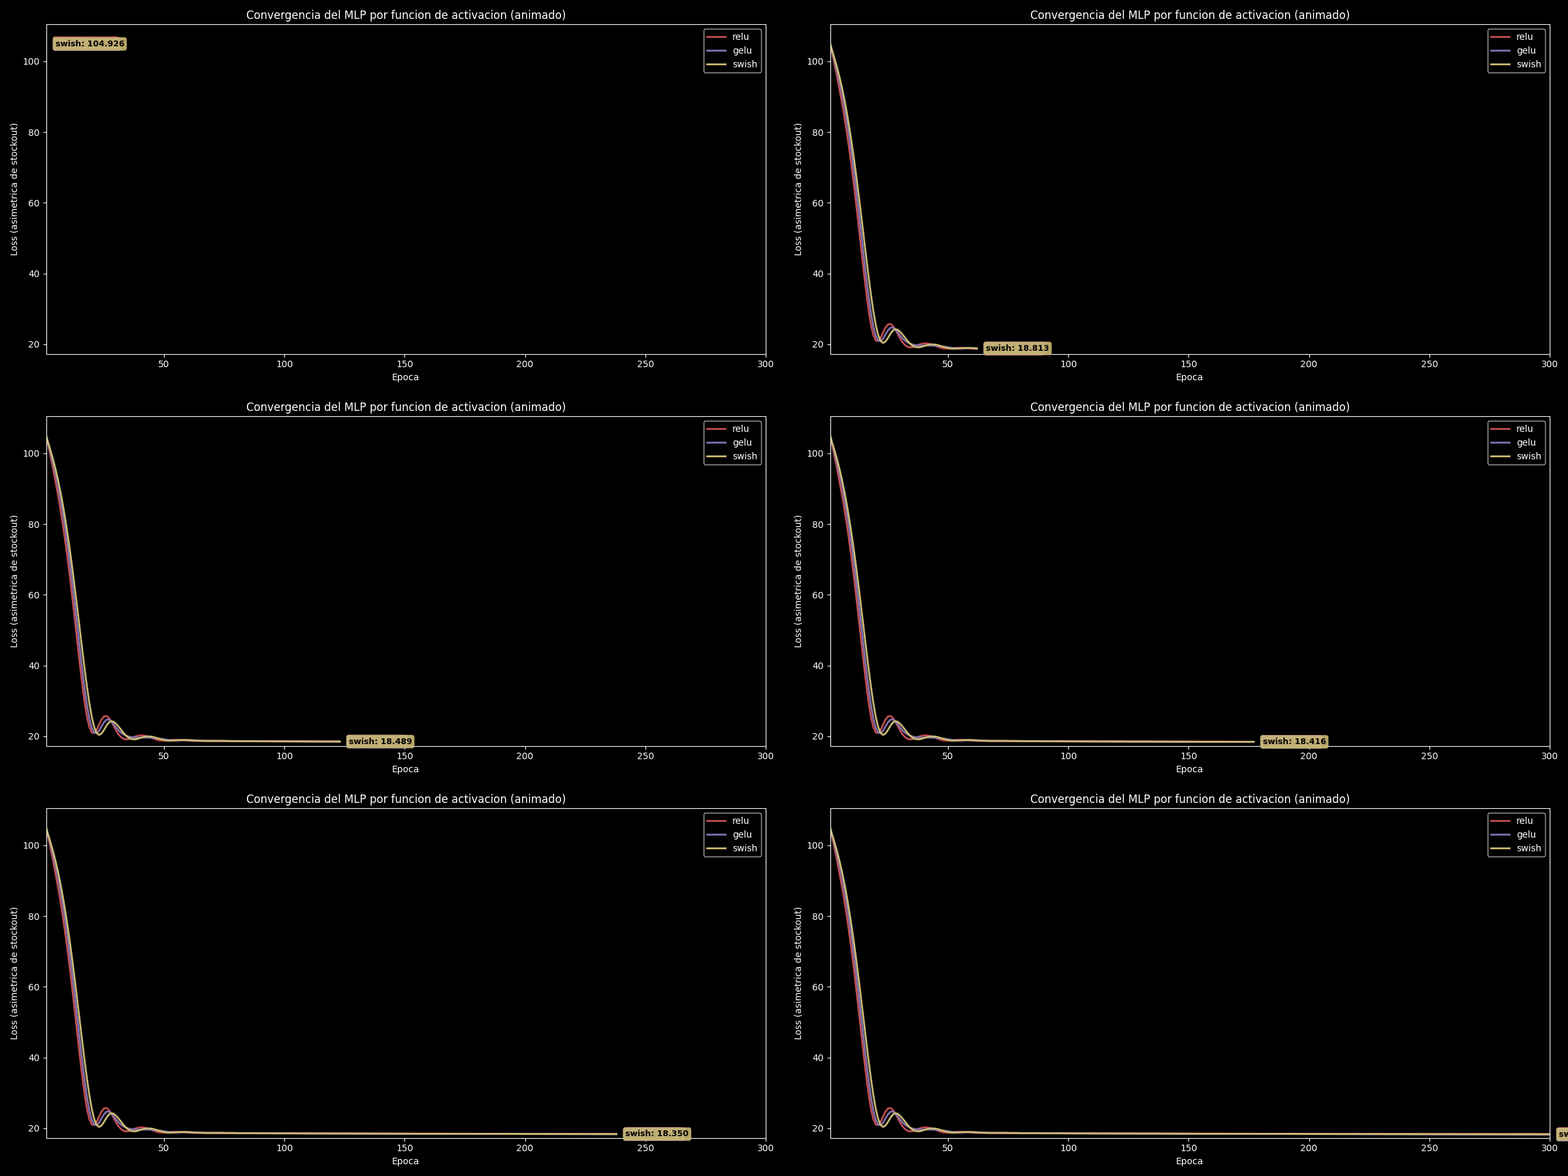
total_demand in the synthetic generator is drawn independently of location (rng.randint(min_demand, max_demand) per order, uncorrelated with comuna or coordinates by construction), so there is little real spatial signal to learn from location alone. The comparison is still meaningful as a methodology demonstration — three genuinely different model families, a domain-specific asymmetric loss, and an honest activation comparison — that would show a real accuracy gap on demand data with actual spatial structure (seasonality, comuna-level income/population correlates, proximity to transit), which this synthetic generator doesn't model.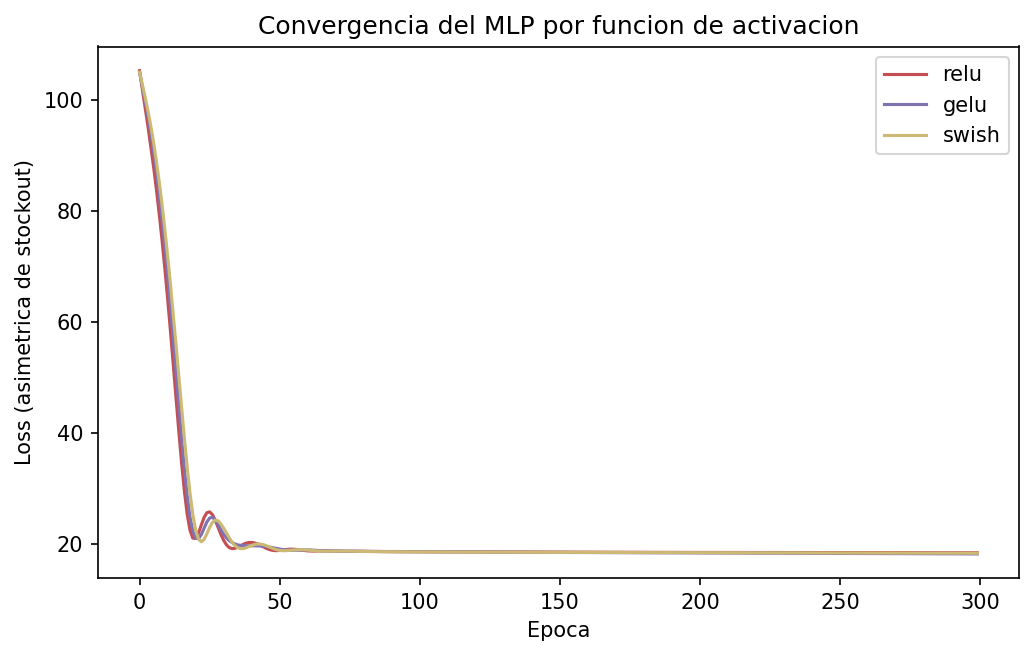
total_demand in the synthetic generator is drawn independently of location (rng.randint(min_demand, max_demand) per order, uncorrelated with comuna or coordinates by construction), so there is little real spatial signal to learn from location alone. The comparison is still meaningful as a methodology demonstration — three genuinely different model families, a domain-specific asymmetric loss, and an honest activation comparison — that would show a real accuracy gap on demand data with actual spatial structure (seasonality, comuna-level income/population correlates, proximity to transit), which this synthetic generator doesn't model.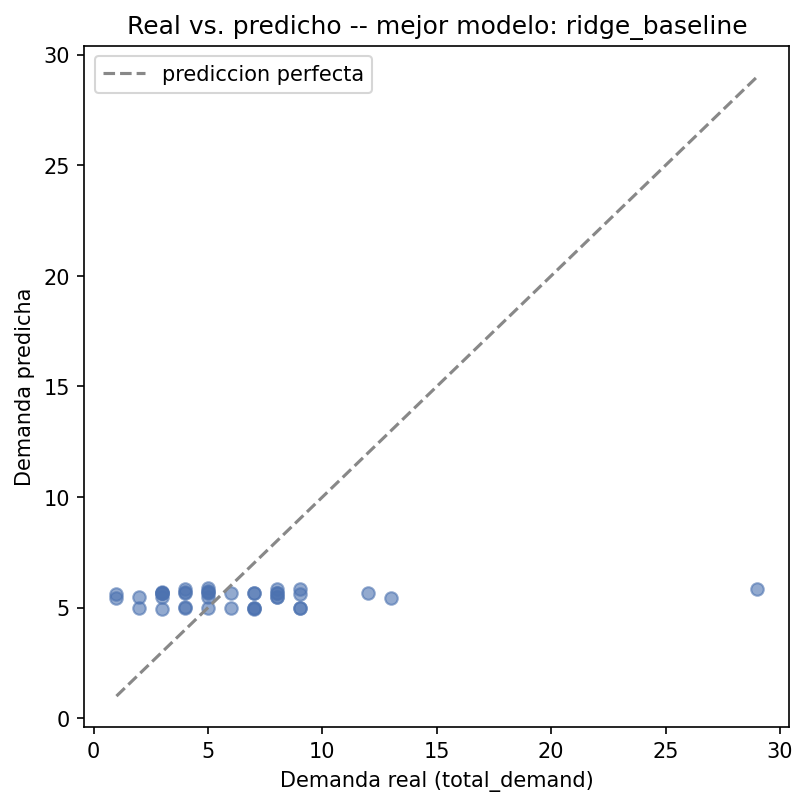
total_demand in the synthetic generator is drawn independently of location (rng.randint(min_demand, max_demand) per order, uncorrelated with comuna or coordinates by construction), so there is little real spatial signal to learn from location alone. The comparison is still meaningful as a methodology demonstration — three genuinely different model families, a domain-specific asymmetric loss, and an honest activation comparison — that would show a real accuracy gap on demand data with actual spatial structure (seasonality, comuna-level income/population correlates, proximity to transit), which this synthetic generator doesn't model.