chile-fintech-systemic-risk
Polyglot architecture for systemic risk analysis of the Chilean financial market (IPSA, Central Bank rates, credit risk). Each language was chosen for the task it solves best, not for portfolio completeness.
This page shows the project's results. The methodology, the design decisions and the limitations are documented in the repository's README.
`/etl` — what already runs
`/ml_predictions` — what already runs
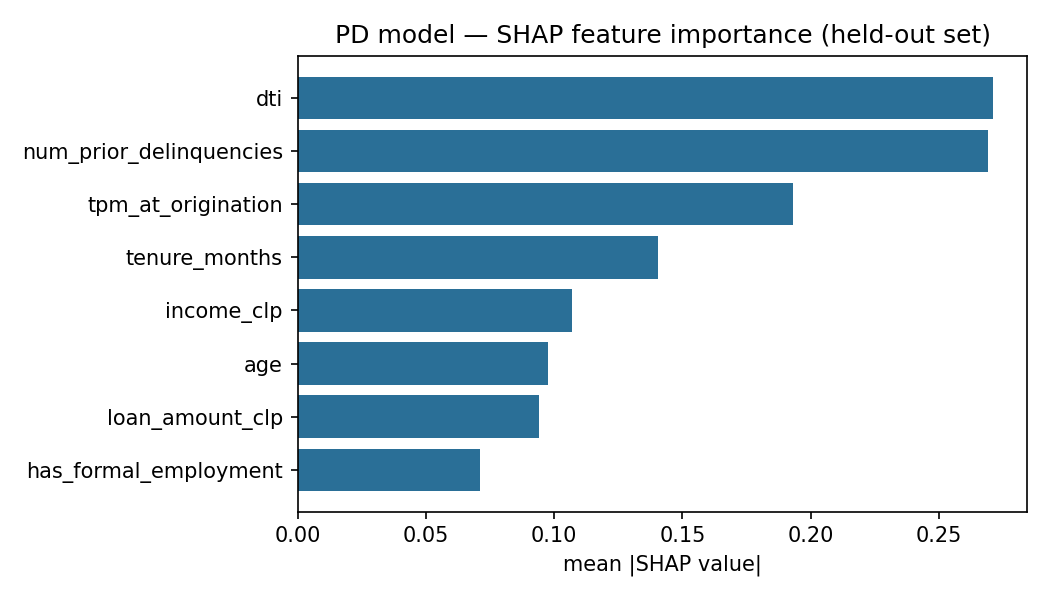
dti and num_prior_delinquencies account for most of the mean |SHAP value| — exactly the two variables that dominate the logistic function used to generate the synthetic defaults, so this chart doubles as a sanity check that the explainability pipeline recovers real signal, not noise. The PD-score distribution shows the (partial, consistent with a 0.62 AUC) separation between applicants who actually defaulted and those who didn't.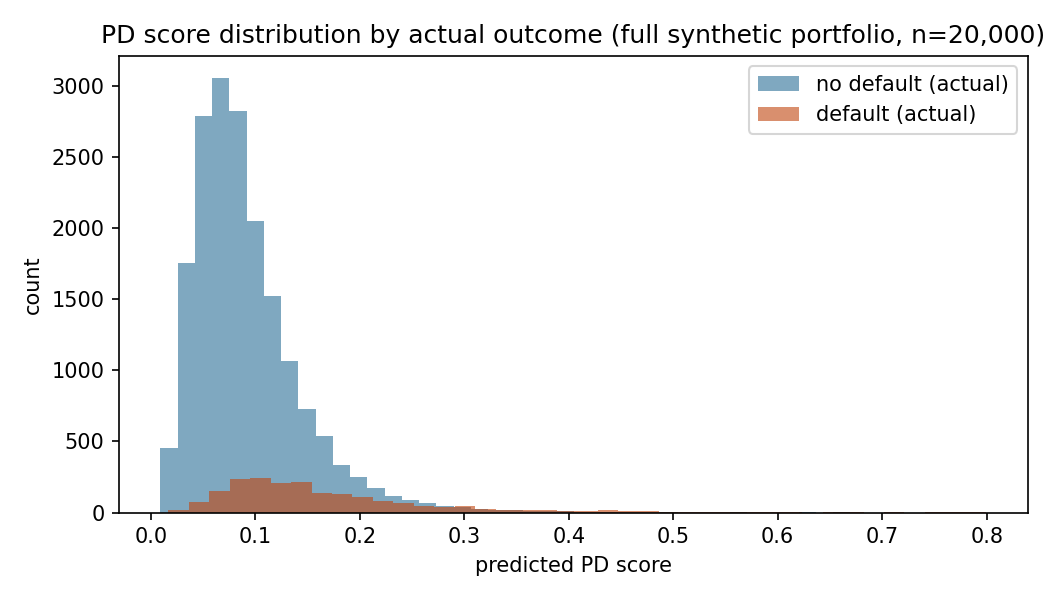
dti and num_prior_delinquencies account for most of the mean |SHAP value| — exactly the two variables that dominate the logistic function used to generate the synthetic defaults, so this chart doubles as a sanity check that the explainability pipeline recovers real signal, not noise. The PD-score distribution shows the (partial, consistent with a 0.62 AUC) separation between applicants who actually defaulted and those who didn't.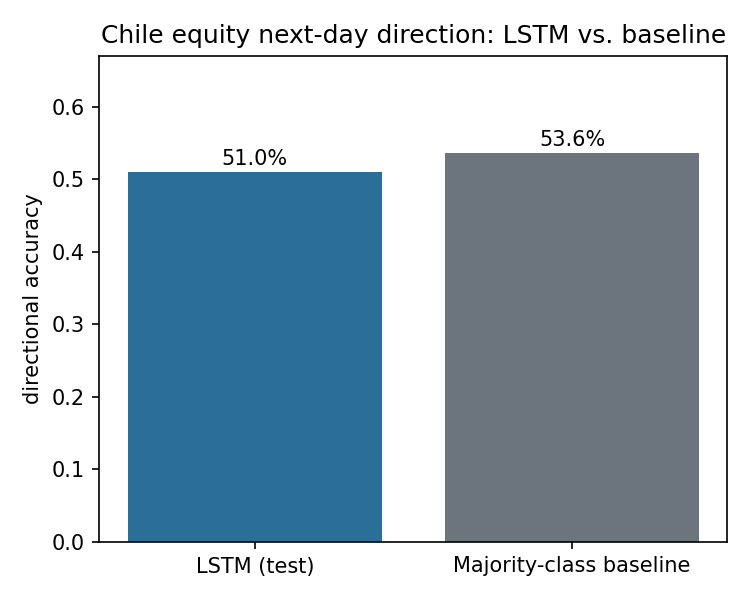
`/quant_analytics` — what already runs
`/core_engine` — what already runs