⚡ Chile Energy Grid Forecasting
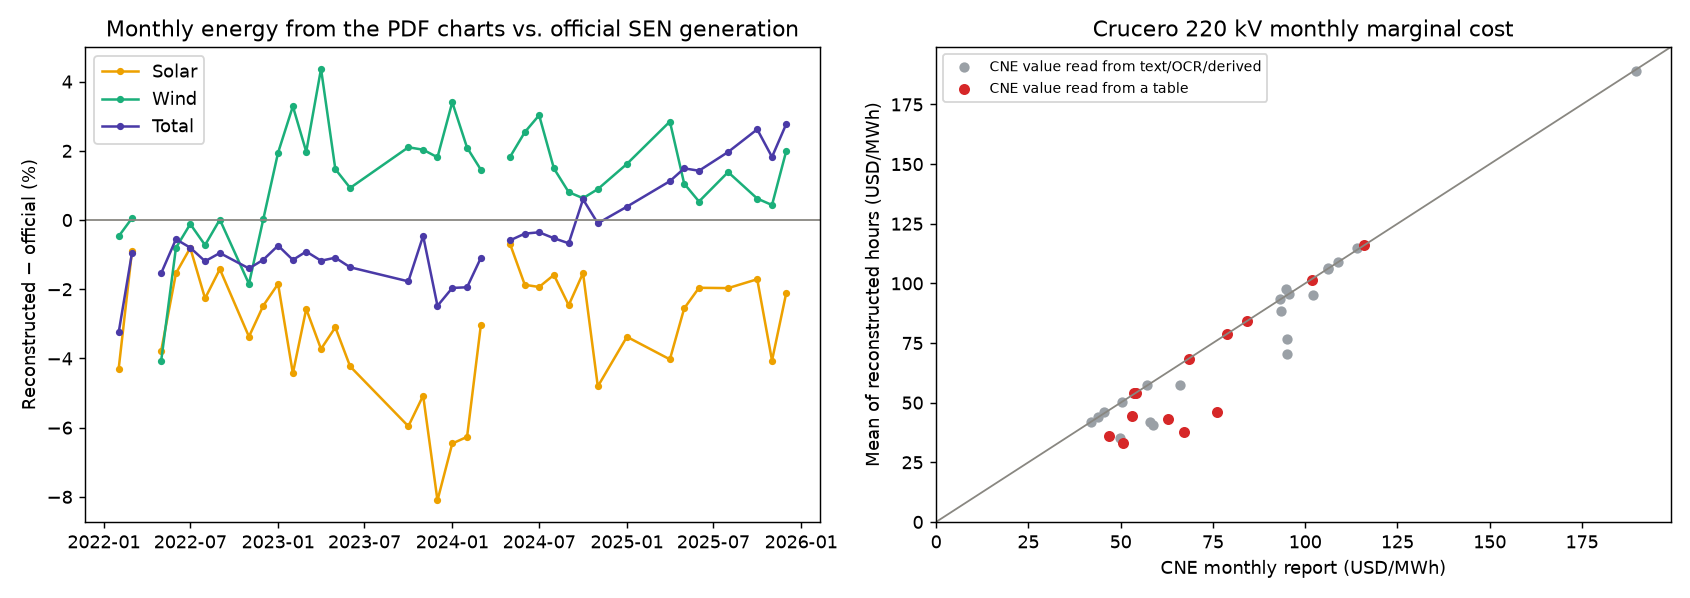
Hourly forecasting of Chile's National Electric System (SEN) on four years of real hourly data (2022-2025): marginal cost at 6 real 220 kV buses from Antofagasta to Puerto Montt, and system-wide solar generation, wind generation and demand. The hourly series are not downloaded from an API (the grid coordinator's requires an institutional account): they are read out of the vector charts in the coordinator's public daily PDF reports, calibrated day by day against the numbers each report prints, and validated against two independent official monthly series. On top of that: LightGBM tuned with Optuna and validated walk-forward against naive baselines, real weather features (ERA5), Rolling-Origin CV against XGBoost, a PyTorch MLP, conformal prediction intervals, a recursive multi-step forecaster and a Streamlit dashboard.
This page shows the project's results. The methodology, the design decisions and the limitations are documented in the repository's README.
2. Data: four years of real hourly data, read out of PDF charts
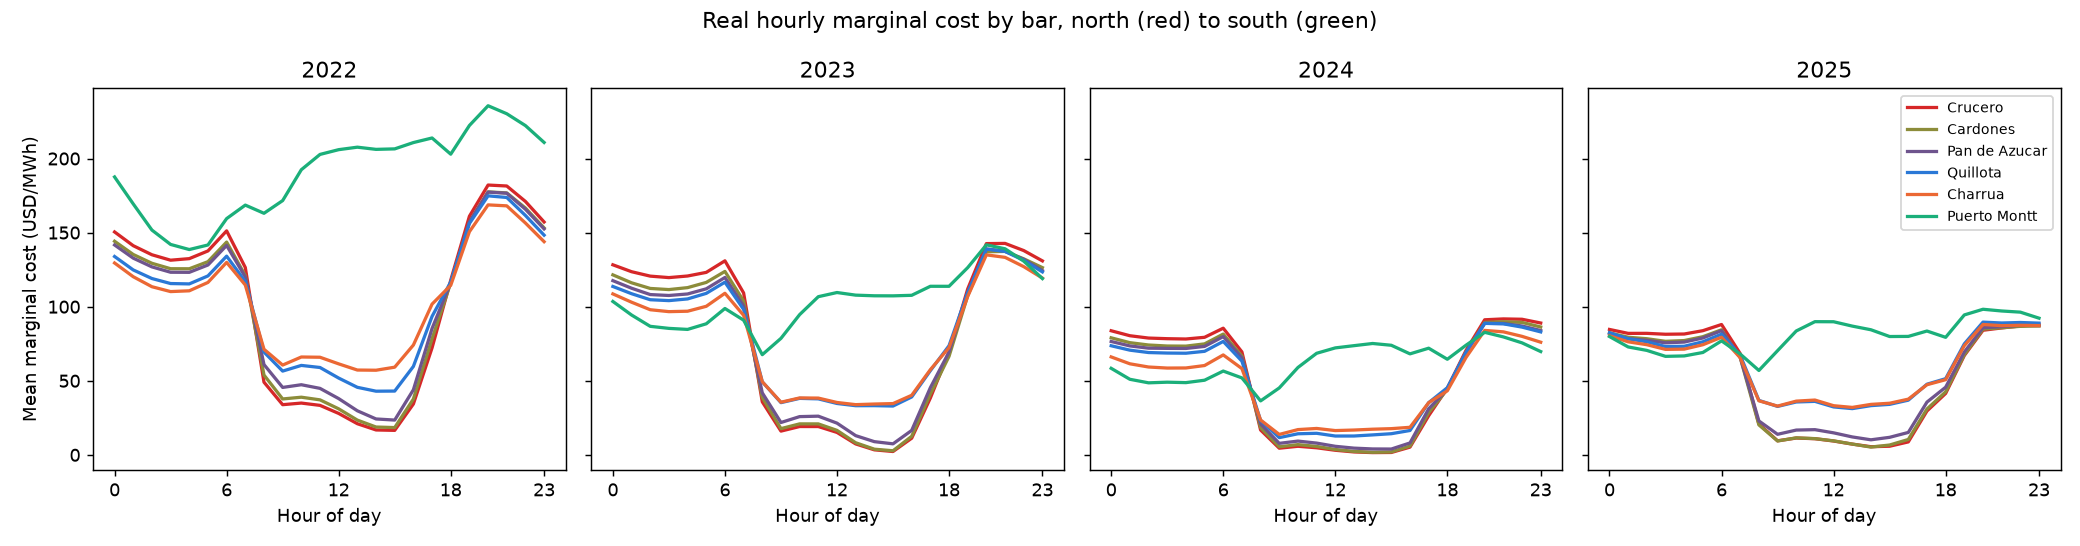
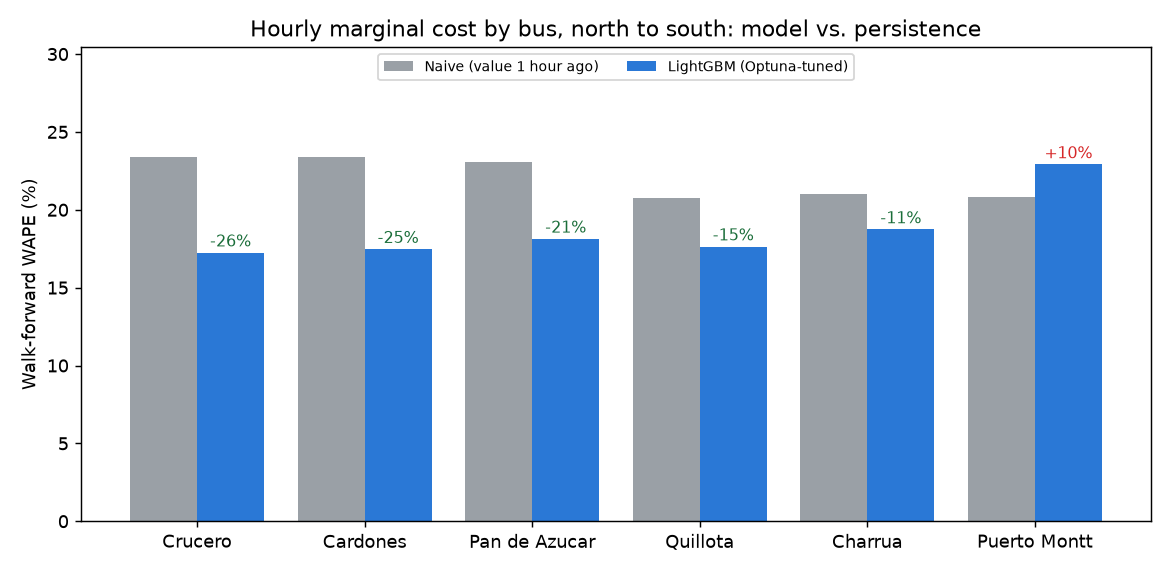
notebooks/01_eda_seasonality_analysis.ipynb): one system-wide driver does not price a bus that transmission isolates.5.1 Walk-forward validation: LightGBM (Optuna-tuned) vs. baselines
5.4 A third modeling family: PyTorch MLP vs. LightGBM/XGBoost, and ReLU vs. GELU vs. Swish
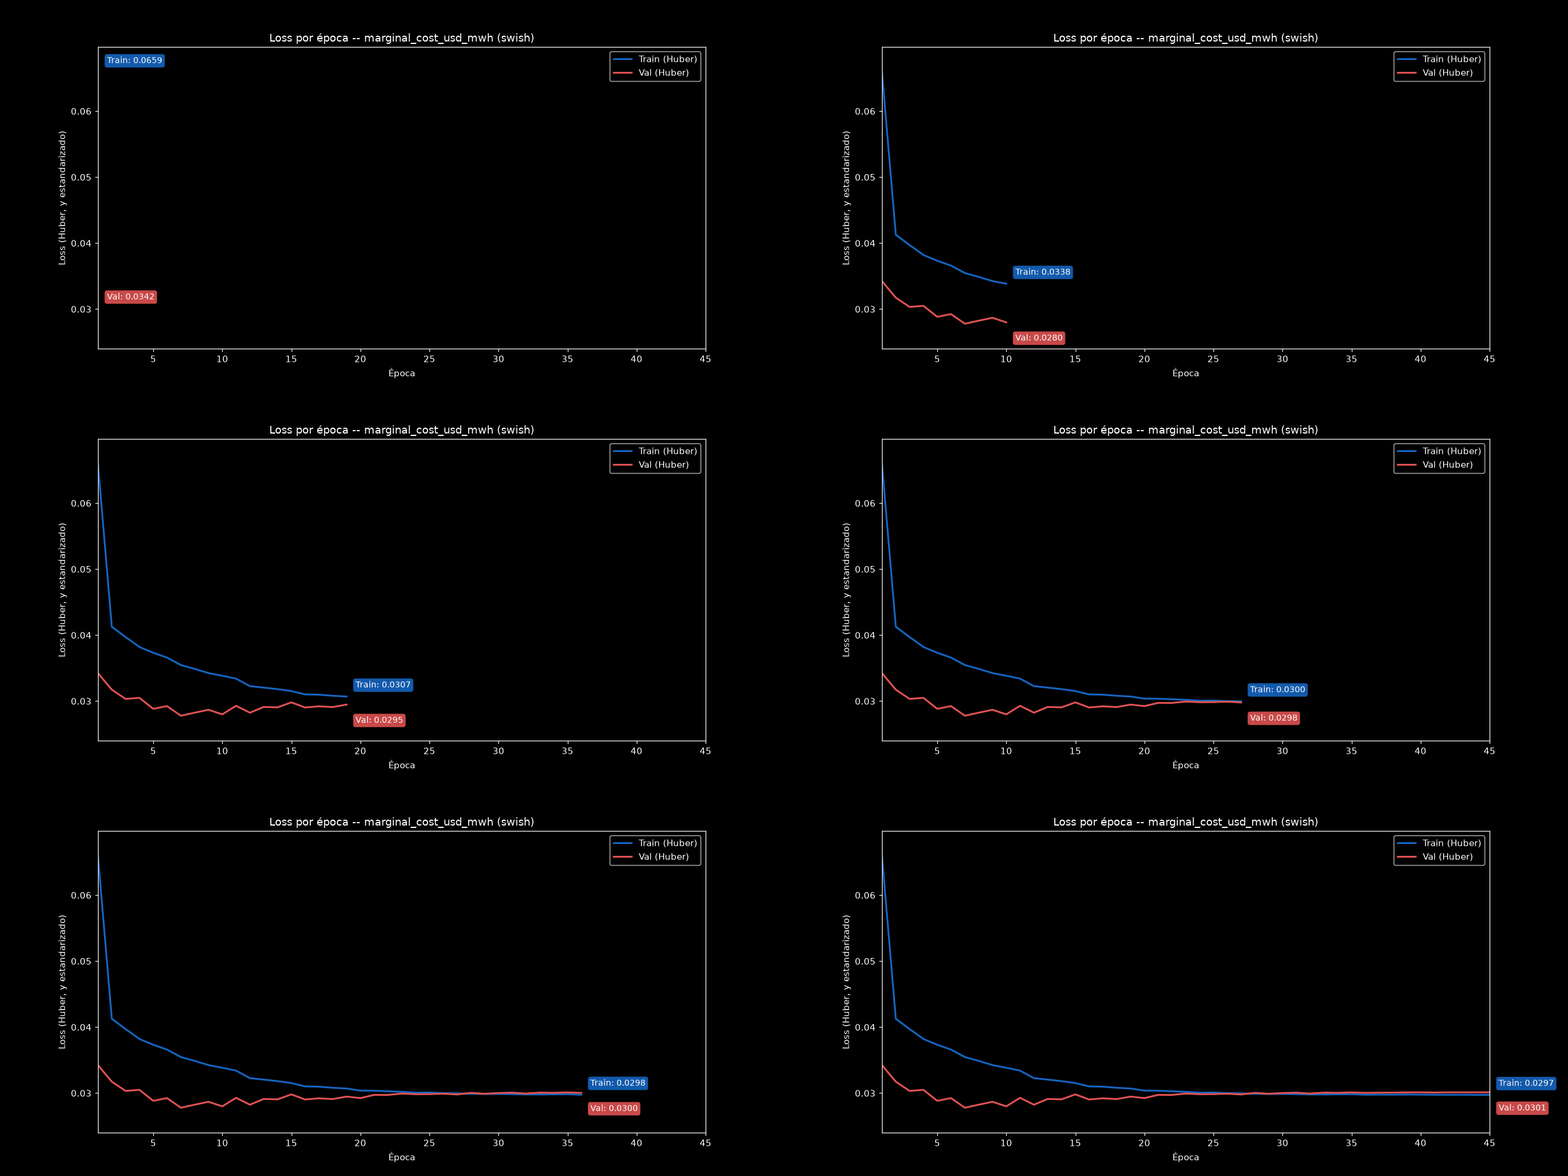
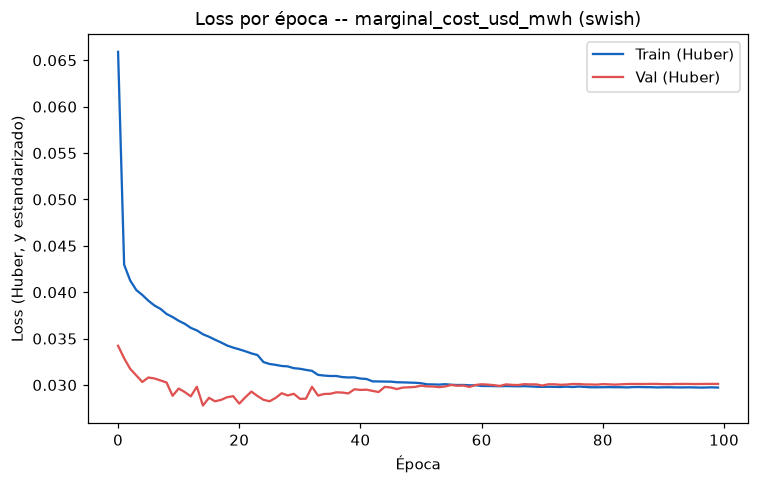
A dense MLP with a custom Huber loss, trained on the same folds and features as the tree models. On the old simulated panel it was the best model on price; on real prices every activation lands at 21.7-22.0% WAPE, above default LightGBM (19.9%) and level with persistence (21.9%). All 15 runs reach their best validation loss between epochs 8 and 21: the network starts overfitting real prices almost immediately.