Which parts will fail quality control?
1.18 million real parts from a Bosch assembly line, 52 stations, 0.58% failing final inspection. The useful question is not a leaderboard metric but an inspection budget: pull the riskiest few percent of parts, and how many failures do you stop?
01Failures come in lots
Parts produced next to a failed part fail at 6.4%, eleven times the base rate. The strongest features describe where a part sits in its lot: whether the next part has a consecutive Id and the same start time. They use timestamps and Ids only, never a neighbour's label, so nothing leaks.
| Features | CV MCC | Later parts MCC |
|---|---|---|
| 968 measurements | 0.228 | 0.061 |
| + process (route, stations, time per line) | 0.231 | 0.038 |
| + sequence (position in the production flow) | 0.402 | 0.207 |
02Cross-validation flatters the model
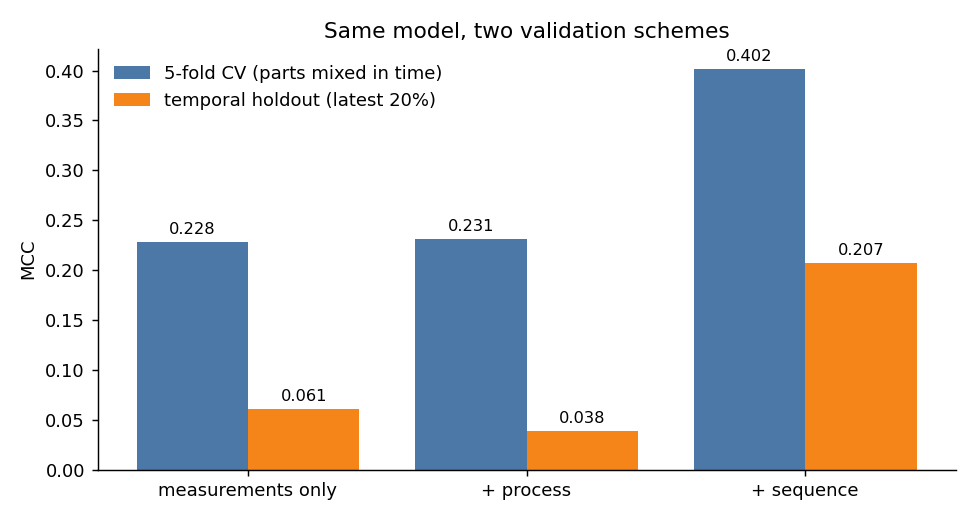
The Kaggle test set interleaves with training parts in time, so the leaderboard (0.418) tracks CV. A model running on the line would see the temporal number, and that is the one the inspection policy below is built on.
03From a score to an inspection policy
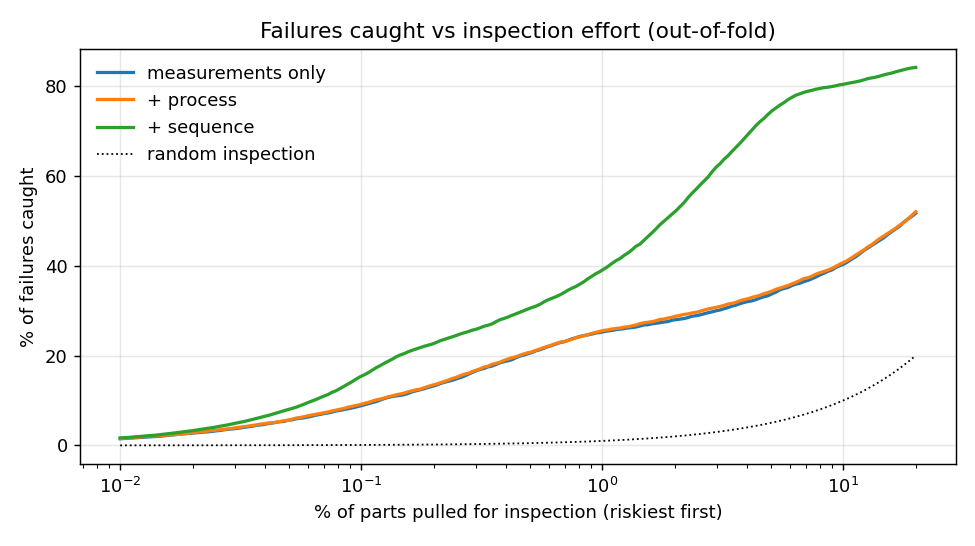
With inspection costing 1 and an escaped failure costing 100, the cost-minimising policy inspects 6.6% of production and brings the cost of quality to 40% of inspecting nothing.
04Caveats
- Measurements are anonymous, so the few that matter (stations S29, S24, S33) cannot be traced to physical quantities.
- One model family, default-ish hyperparameters, no ensembling beyond three seeds.
- The cost model assumes inspection catches every failure it examines.