El hackeo de US$6.300 millones a Binance: lo que le hizo al mercado cripto, y lo que no The $6.3B Binance hack: what it did to crypto markets, and what it didn't
El 29 de octubre de 2026 a las 20:05 UTC las wallets calientes de Binance en diez blockchains empezaron a enviar monedas a un atacante: 6.360 millones de dólares según TRM Labs, el mayor robo cripto registrado. Bitcoin cayó bajo 77.000 dólares y los titulares culparon al hackeo. Pero cinco minutos antes había cerrado Nueva York y los futuros del Nasdaq caían por los resultados de Amazon e Intel. Desarmé esa noche minuto a minuto con datos reales de Binance, Coinbase, OKX y Yahoo, la comparé con 36 hackeos a exchanges desde 2011 y probé si las noticias, la guerra y la macro pueden pronosticar el precio.
At 20:05 UTC on 29 October 2026 Binance's hot wallets on ten blockchains began sending coins to an attacker: $6.36 billion according to TRM Labs, the largest crypto theft on record. Bitcoin fell below $77,000 and the headlines blamed the hack. But five minutes earlier New York had closed and Nasdaq futures were falling on Amazon's and Intel's earnings. I took that night apart minute by minute with real data from Binance, Coinbase, OKX and Yahoo, compared it with 36 exchange hacks since 2011, and tested whether news, war and macro data can forecast the price.
En 30 segundosIn 30 seconds
- El hackeo dolió, pero no fue lo único. Bitcoin cayó 5,1% hasta el 2 de noviembre, y la caída de las tecnológicas predice cerca de 3,4% a 3,7% de eso.
- El precio delató el robo. BNB cayó tanto que una alarma simple saltó a las 20:33 UTC, 42 minutos antes de que CZ lo admitiera.
- El castigo fue para Binance, no para lo robado. Las monedas de las cadenas vaciadas no cayeron más que el resto; BNB sí.
- Hubo corrida, pero ordenada. Los clientes sacaron 8,7 mil millones de dólares en dos días, 6% de lo que había.
- La historia no muestra un efecto claro. Tras 35 hackeos anteriores, BTC a una semana no se distingue de una fecha cualquiera; a un año queda -10,9% contra +15,6%, sin ser concluyente (p = 0,12).
- Nadie puede predecir el precio de mañana con estos datos. Cinco modelos, incluidas redes neuronales, no superan a decir "queda igual". La turbulencia sí se anticipa, y para eso bastan los datos de precio.
- The hack hurt, but it was not alone. Bitcoin fell 5.1% to 2 November, and the tech sell-off predicts about 3.4% to 3.7% of that.
- The price gave the theft away. BNB fell so hard that a simple alarm fired at 20:33 UTC, 42 minutes before CZ admitted it.
- Binance was punished, not the stolen coins. Coins on drained chains did not fall more than the rest; BNB did.
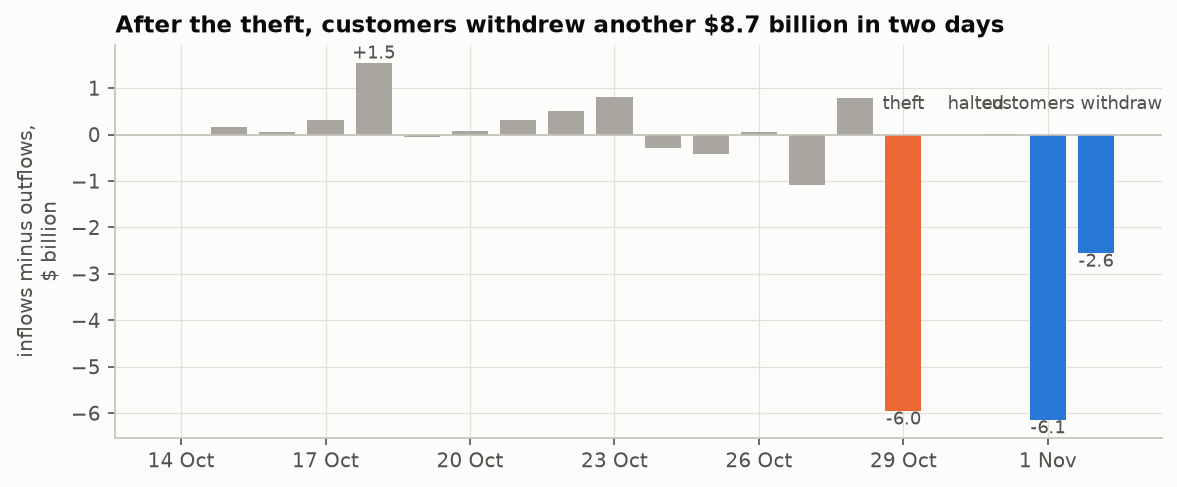
- There was a run, but an orderly one. Customers took out $8.7 billion in two days, 6% of holdings.
- History shows no clear effect. After 35 earlier hacks, BTC a week later looks like any other date; a year later it stands at -10.9% against +15.6%, which is not conclusive (p = 0.12).
- Nobody can predict tomorrow's price with this data. Five models, neural networks included, do not beat saying "no change". Turbulence can be anticipated, and price data is enough for that.
01¿Qué pasó esa noche?What happened that night?
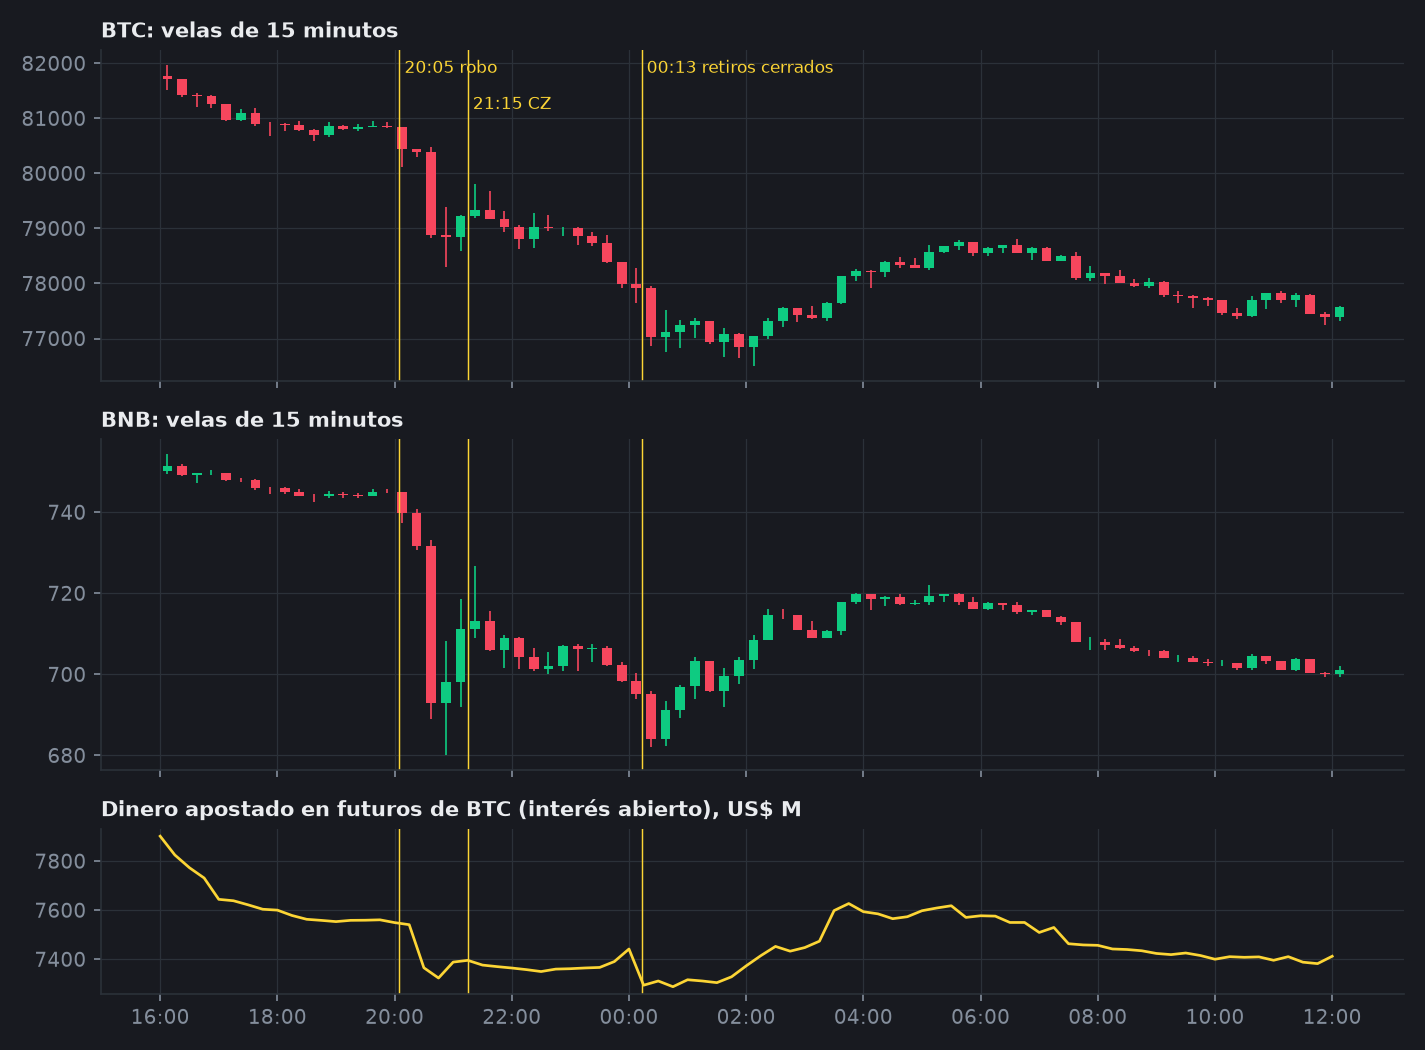
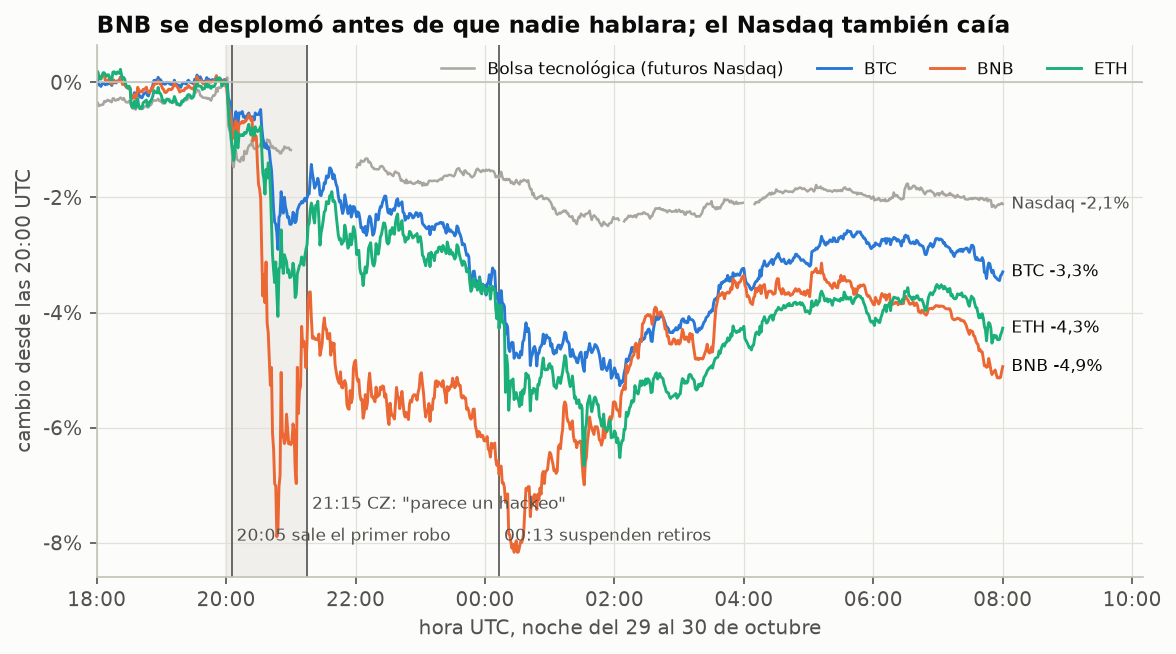
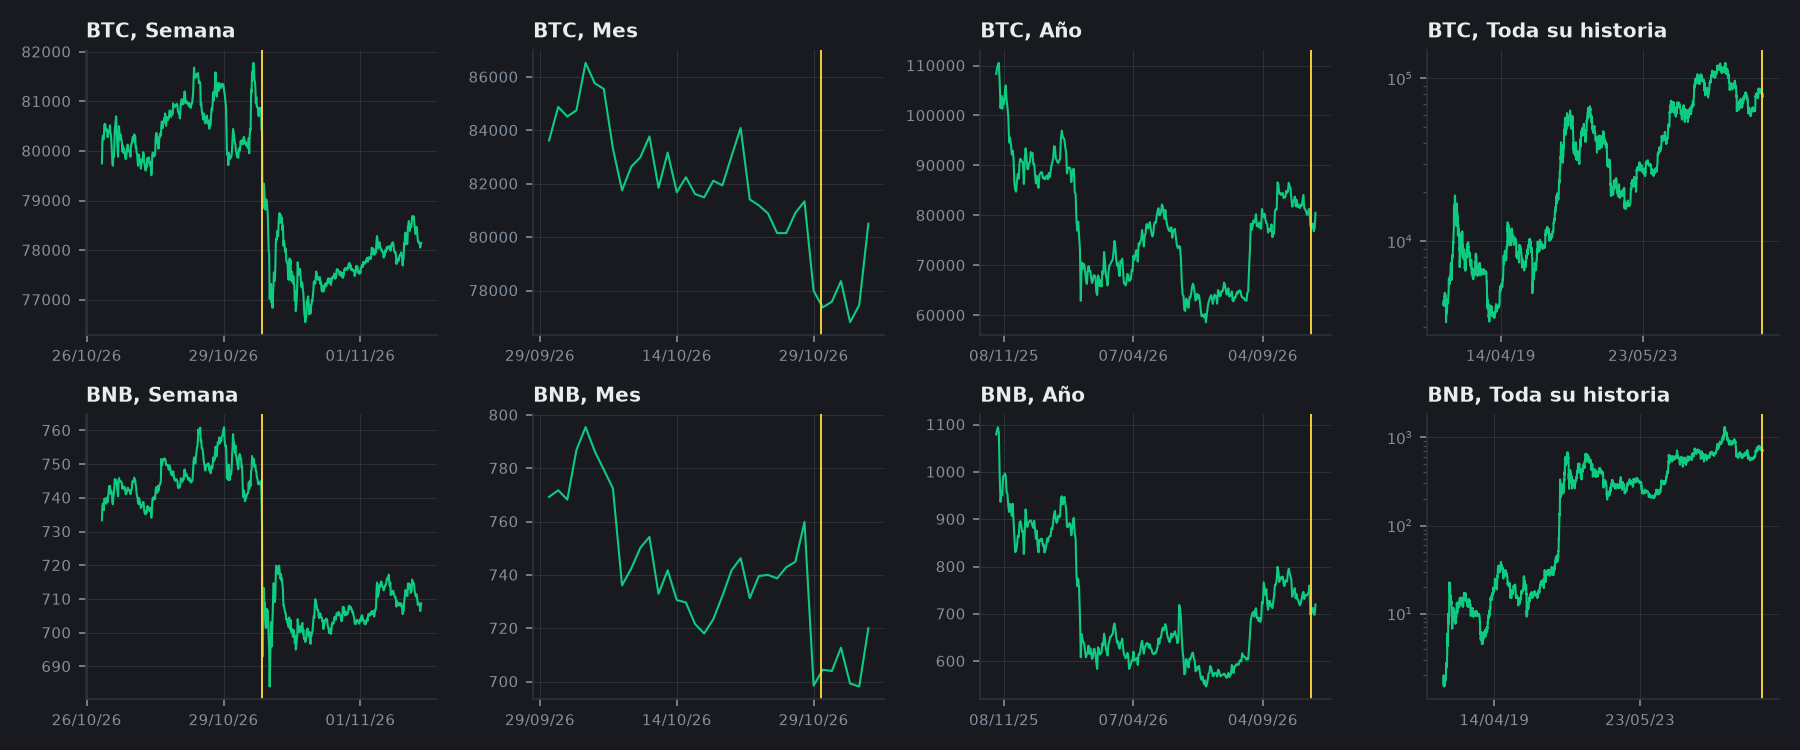
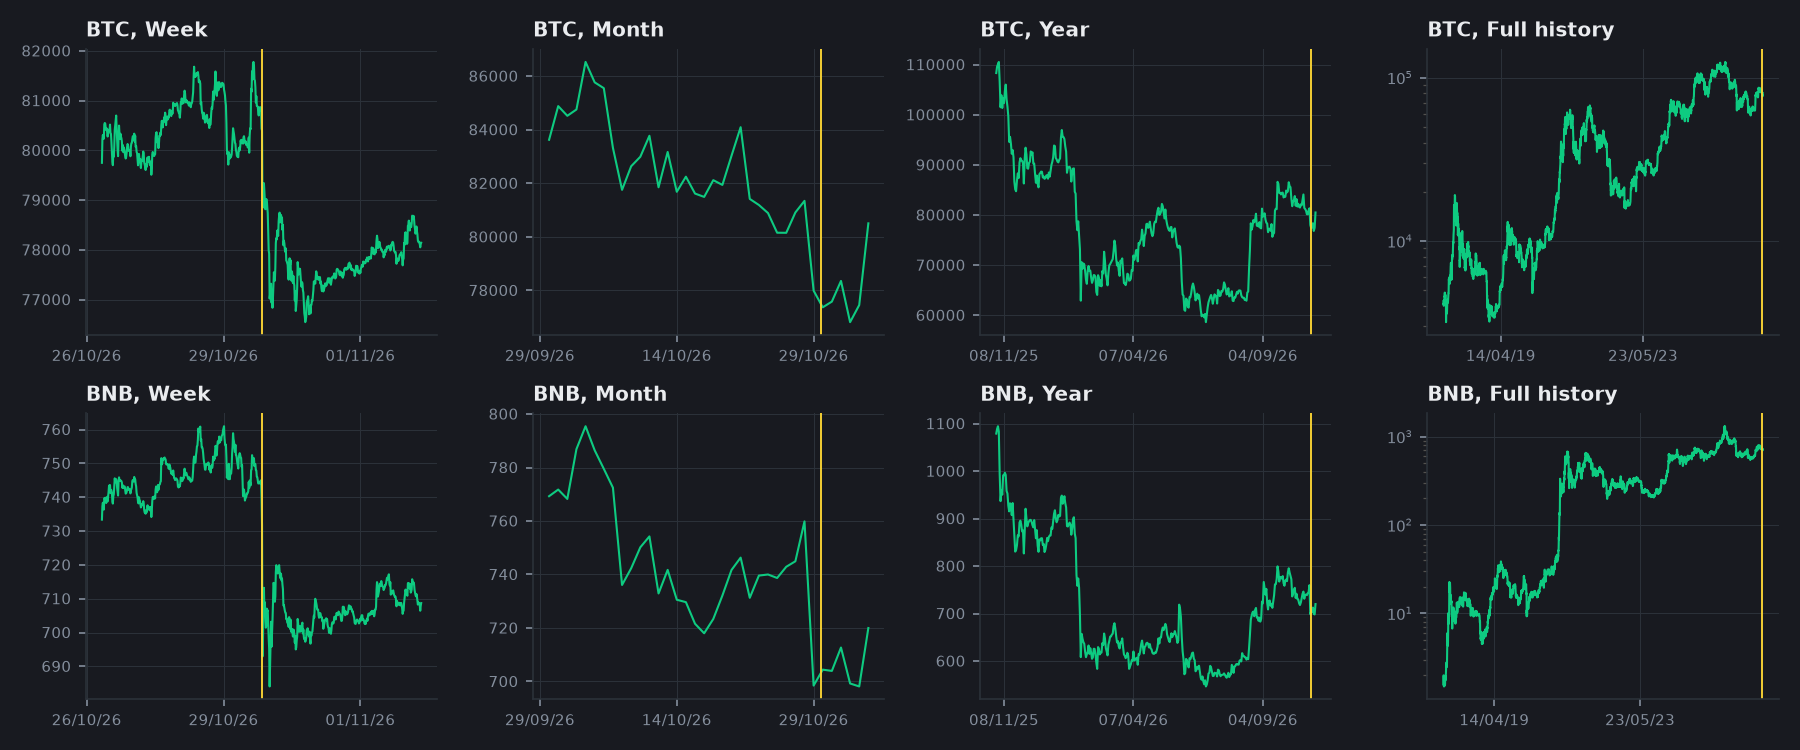
A las 20:05 UTC del 29 de octubre empezaron a salir monedas de Binance hacia un atacante. En una hora BNB perdió cerca de 8% y BTC 3%. Binance suspendió los retiros a las 00:13 y reabrió 54 horas después.
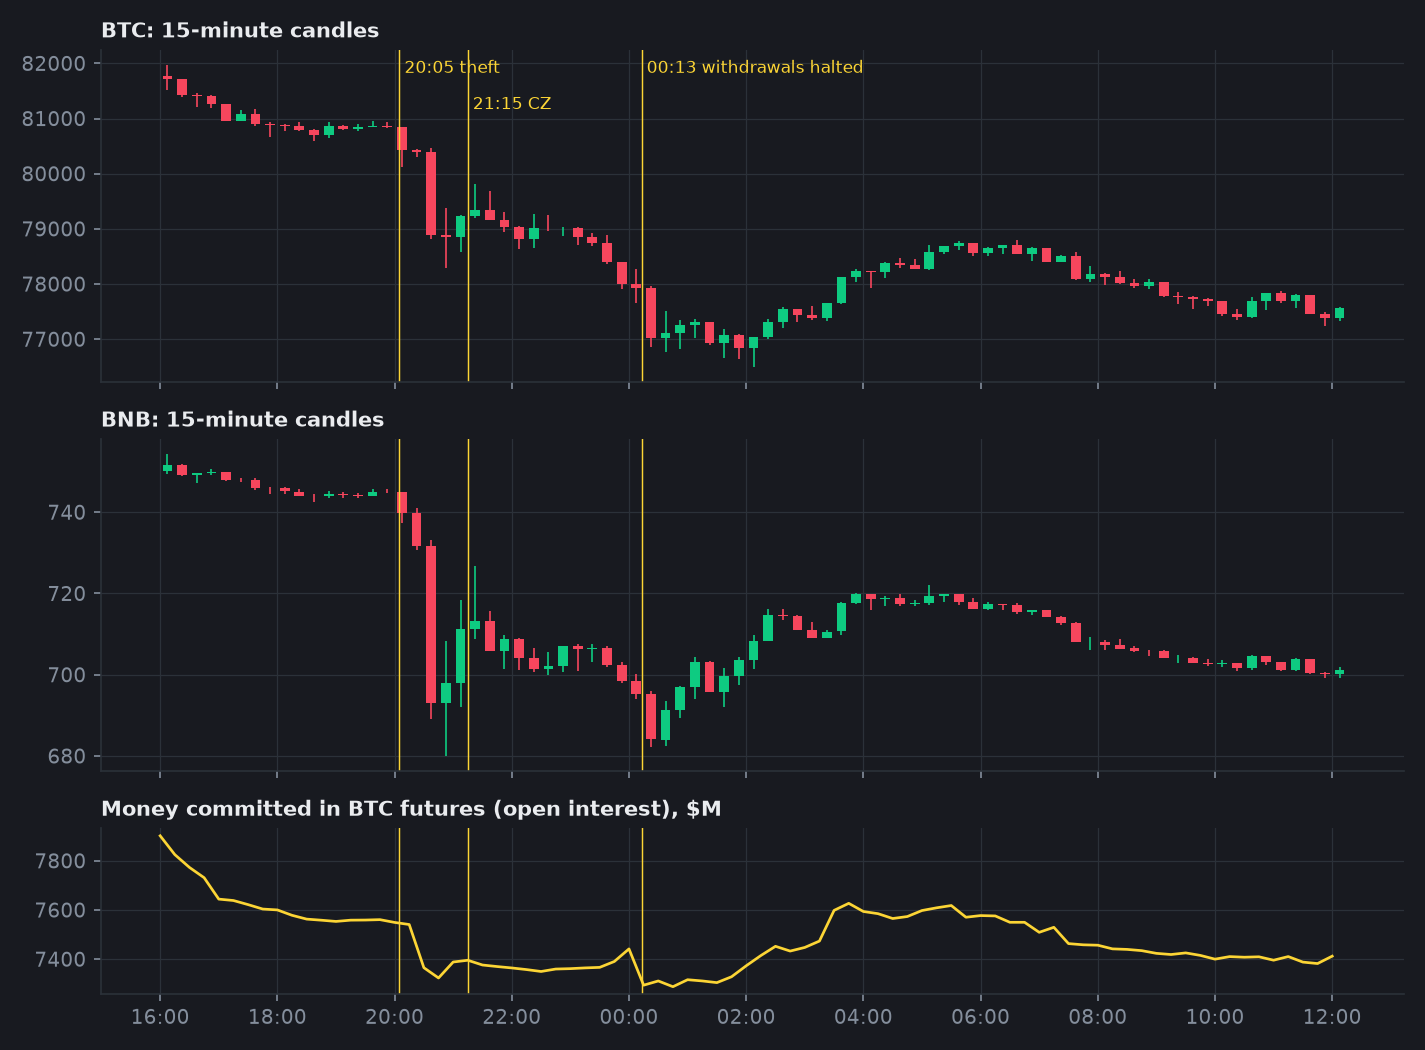
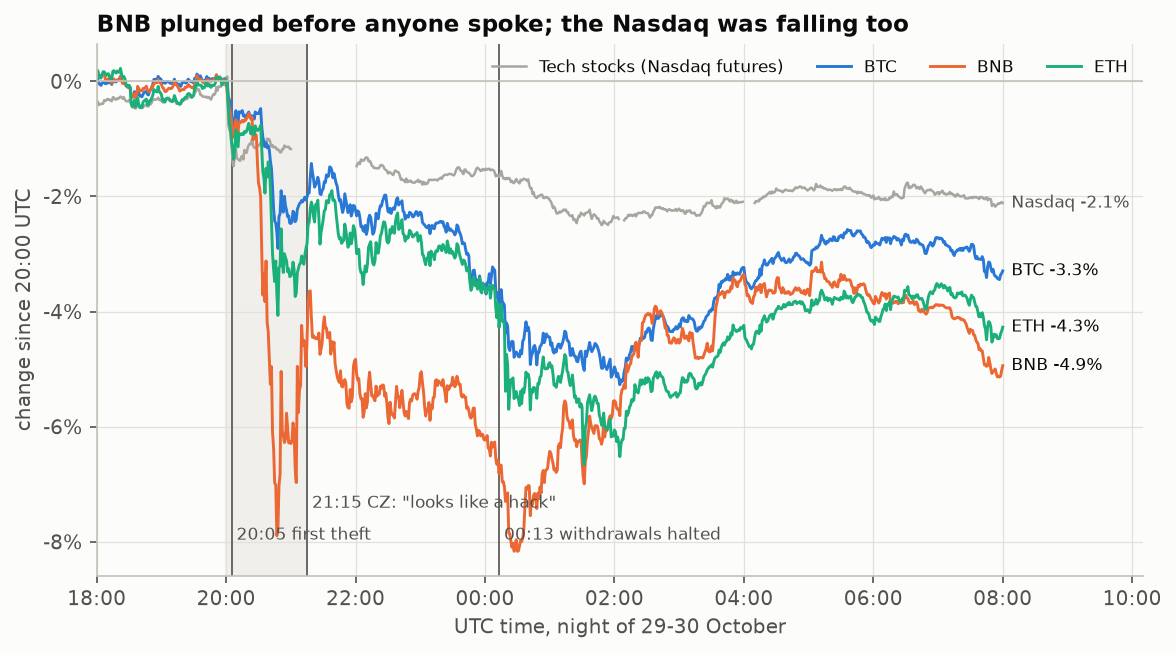
At 20:05 UTC on 29 October coins began leaving Binance for an attacker. Within an hour BNB had lost about 8% and BTC 3%. Binance halted withdrawals at 00:13 and reopened 54 hours later.
| From 20:00 UTC, Oct 29, to | BTC | ETH | BNB | XRP | SOL | TRX |
|---|---|---|---|---|---|---|
| Desde las 20:00 UTC del 29 oct hasta | BTC | ETH | BNB | XRP | SOL | TRX |
| 21:15, CZ: "parece un hackeo"21:15, CZ: "does look like a hack" | -2.0% | -2.9% | -4.6% | -2.5% | -3.0% | +3.0% |
| 00:13, retiros suspendidos00:13, withdrawals halted | -4.0% | -4.4% | -7.1% | -4.1% | -4.8% | +8.3% |
| 06:00 del 1 nov, reapertura06:00 Nov 1, reopening | -3.7% | -2.9% | -5.4% | -2.1% | -4.1% | -6.6% |
| cierre del 2 novclose of Nov 2 | -5.1% | -3.6% | -6.3% | -2.5% | -8.2% | -3.7% |
02¿Cayó por el hackeo o por la bolsa?Did it fall because of the hack or the stock market?
Por los dos, y más por la bolsa. Justo cuando partió el robo, Amazon e Intel publicaron resultados y las tecnológicas cayeron. De los 0,1 puntos que cayó BTC hasta el 2 de noviembre, 0,0 a 0,0 los predice ese mercado; solo 0,0 a 0,0 son propios del hackeo.
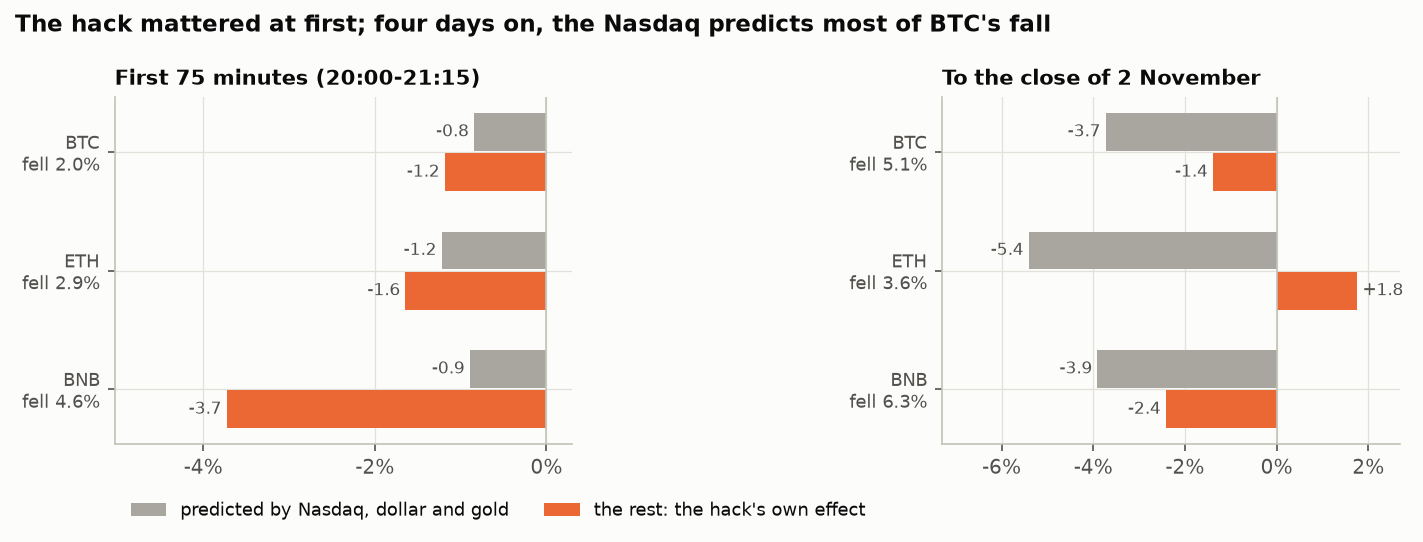
Both, and more the stock market. Just as the theft began, Amazon and Intel published earnings and tech stocks fell. Of the 0.1 points BTC fell to 2 November, that market predicts 0.0 to 0.0; only 0.0 to 0.0 belong to the hack.
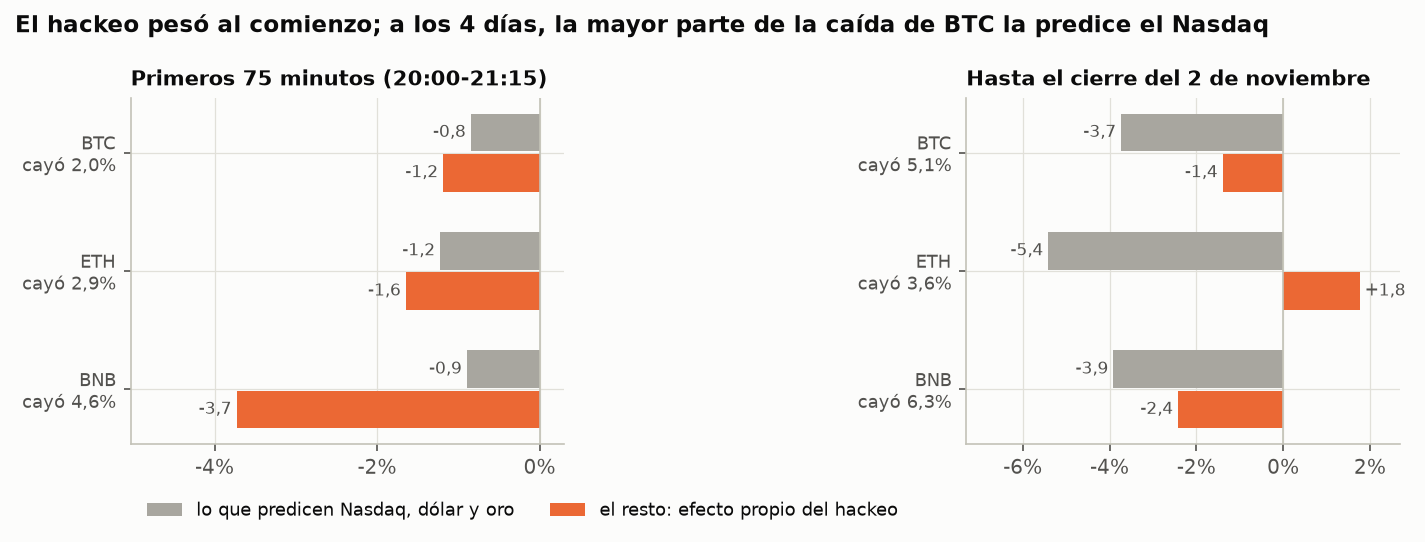
El modelo explica 37% de los movimientos de 5 minutos de BTC en una semana tranquila, así que es una aproximación. Antes de cualquier declaración, el efecto propio en BTC fue -1,2%.
The model explains 37% of BTC's five-minute moves in a calm week, so it is an approximation. Before any statement, the hack's own effect on BTC was -1.2%.
03¿El mercado se enteró antes que el público?Did the market know before the public?
Sí. El robo se ve en la blockchain, y alguien lo estaba mirando. BNB empezó a caer respecto de BTC antes de cualquier declaración: una alarma simple saltó 42 minutos antes de que CZ lo admitiera. En el hackeo de 2019 pasó lo contrario: saltó 14 minutos después del anuncio.
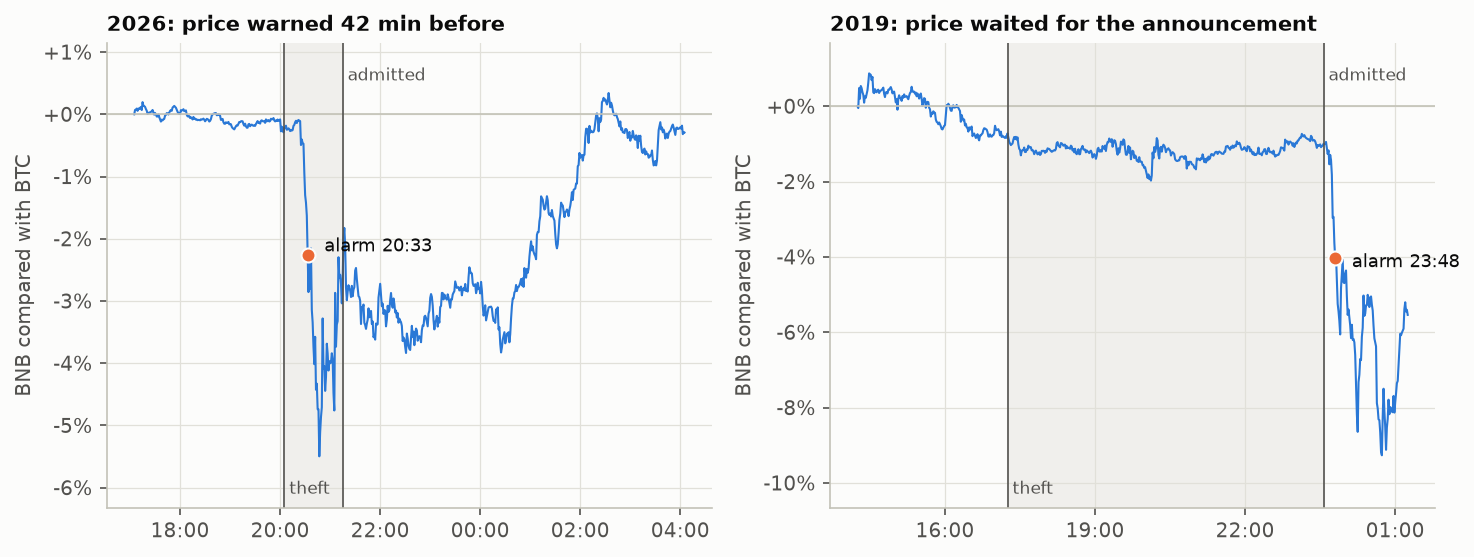
Yes. The theft is visible on the blockchain, and someone was watching. BNB began falling against BTC before any statement: a simple alarm fired 42 minutes before CZ admitted it. In the 2019 hack the opposite happened: it fired 14 minutes after the announcement.
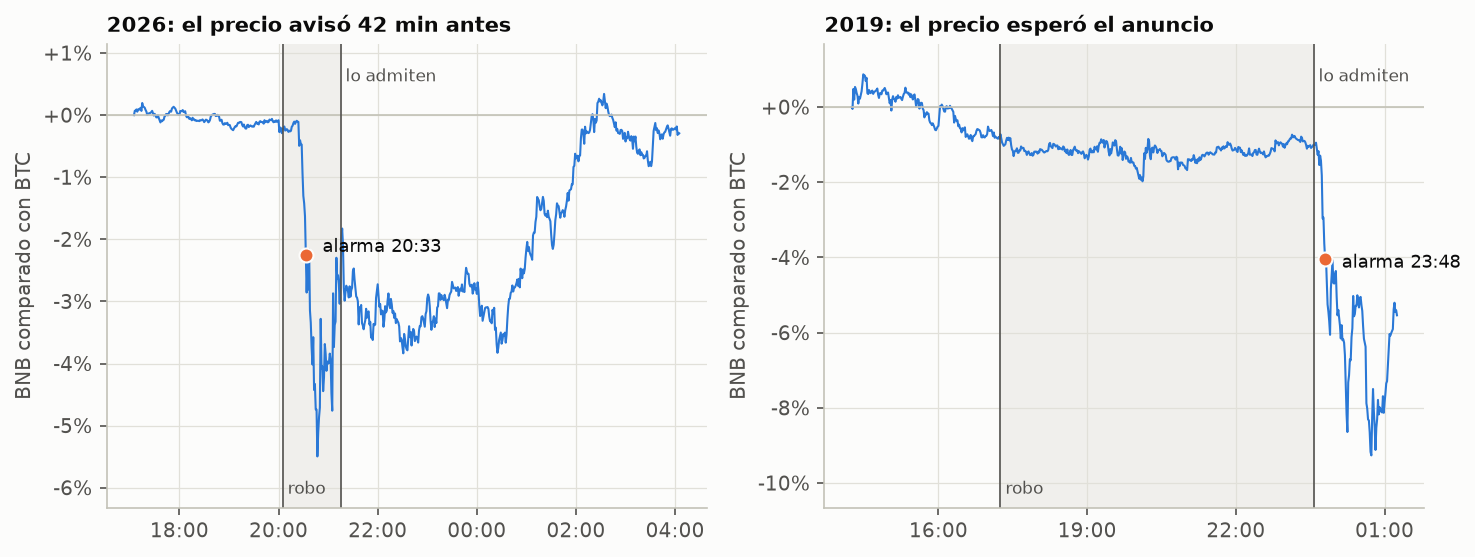
La alarma está calibrada para sonar como máximo una vez al mes, y en los 30 días previos al hackeo dio 0 falsas alarmas. En esos primeros 75 minutos, BNB transó 55 veces su volumen normal.
The alarm is set to ring at most once a month, and it gave 0 false alarms in the 30 days before the hack. In those first 75 minutes, BNB traded 55 times its usual volume.
04¿Qué monedas sufrieron y cuáles ya se recuperaron?Which coins suffered, and which have recovered?
Se castigó a BNB, el token de Binance. Las monedas robadas no cayeron más que las otras: el mercado no apostó a que el ladrón vendería. Al 2026-11-04, ETH y XRP ya superan su precio previo; BTC está a -0,4%; BNB a -3,3%.
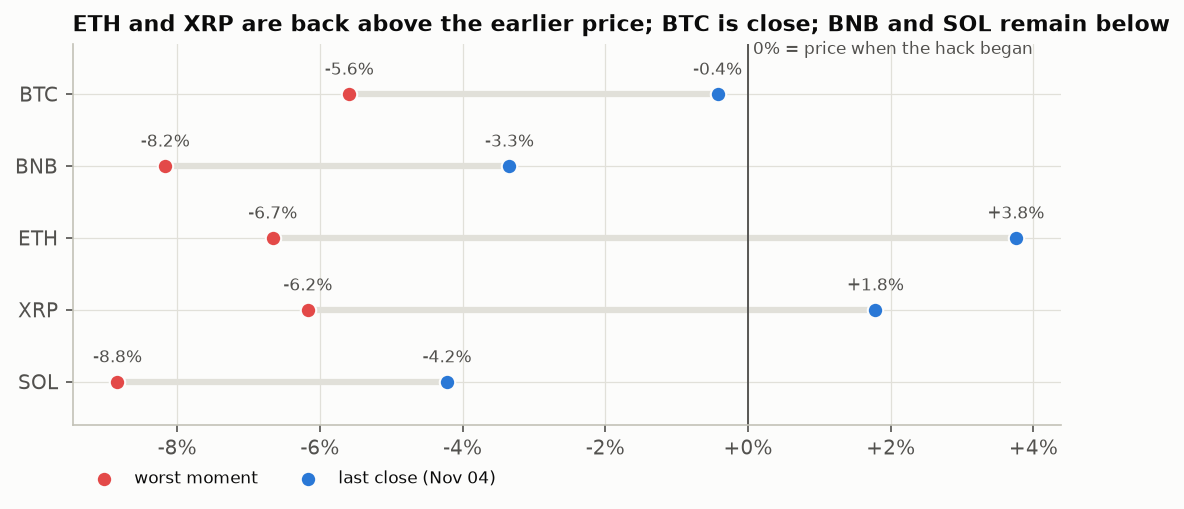
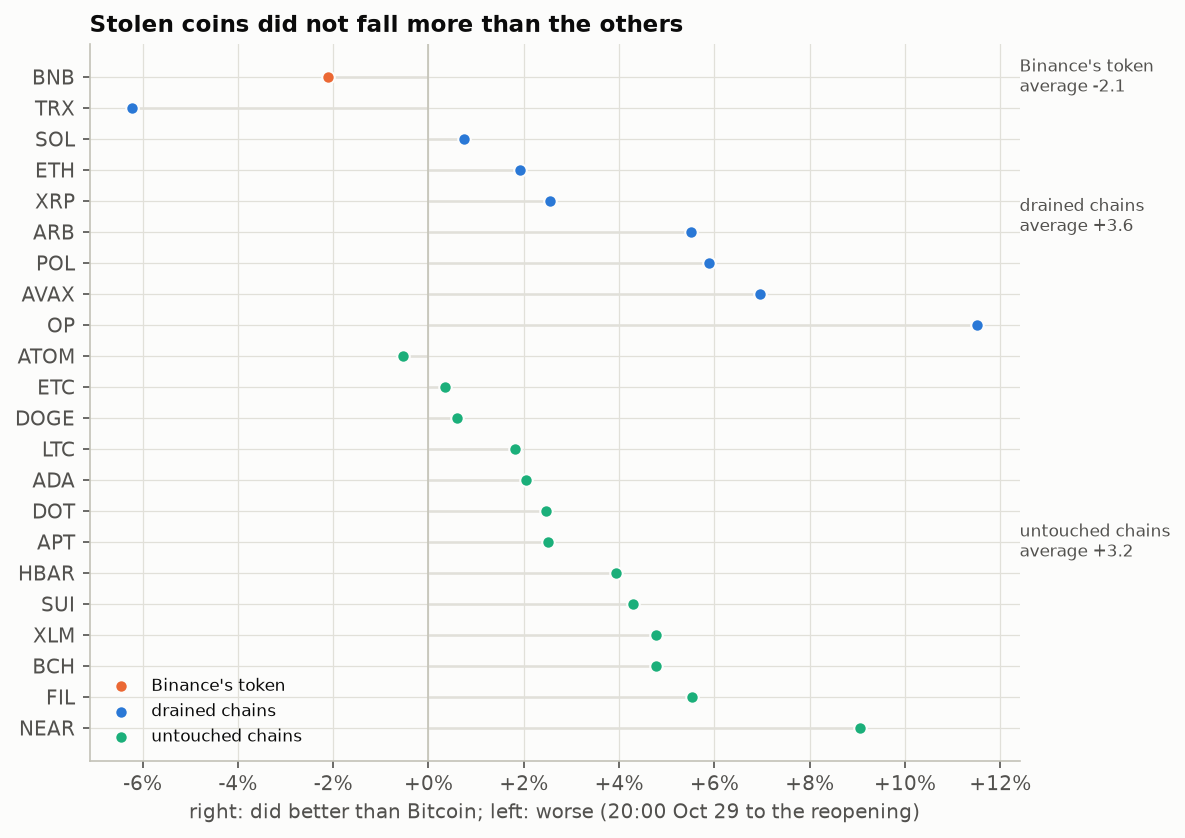
BNB, Binance's token, was punished. Stolen coins did not fall more than the others: the market did not bet on the thief selling. As of 2026-11-04, ETH and XRP are back above their earlier price; BTC stands at -0.4%; BNB at -3.3%.
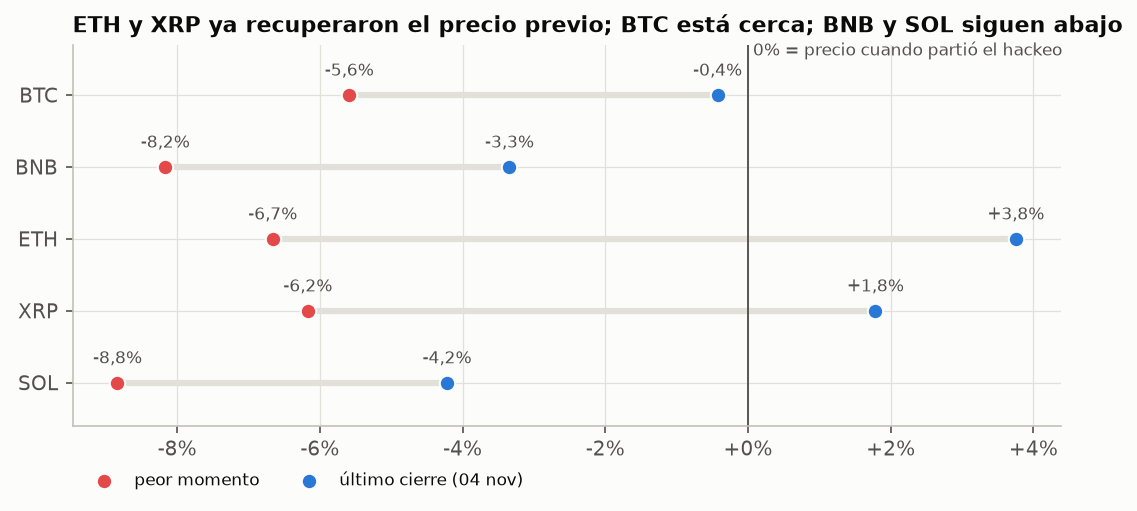
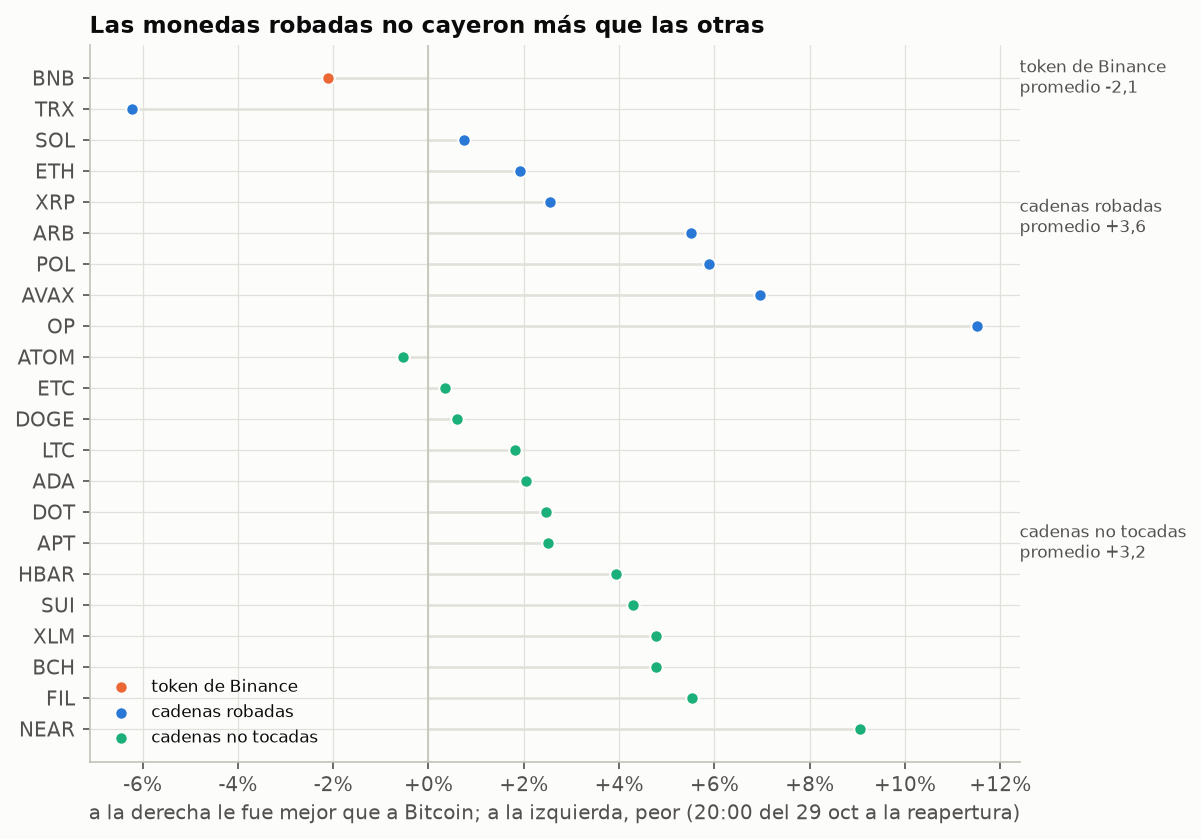
Promedio hasta la reapertura: robadas +3,6%, no tocadas +3,2%, BNB -2,1%. La diferencia entre robadas y no tocadas no es distinguible del azar (p = 0,81; en los primeros 75 minutos p = 0,17). TRX es la rareza: subió 8% durante el hackeo y después lo devolvió todo. No encontré evidencia que lo explique.
Average to the reopening: stolen +3.6%, untouched +3.2%, BNB -2.1%. The gap between stolen and untouched cannot be told from chance (p = 0.81; in the first 75 minutes p = 0.17). TRX is the oddity: it rose 8% during the hack and then gave it all back. I found no evidence that explains it.
05¿Cuánto se transó y quién vendió?How much traded, and who sold?
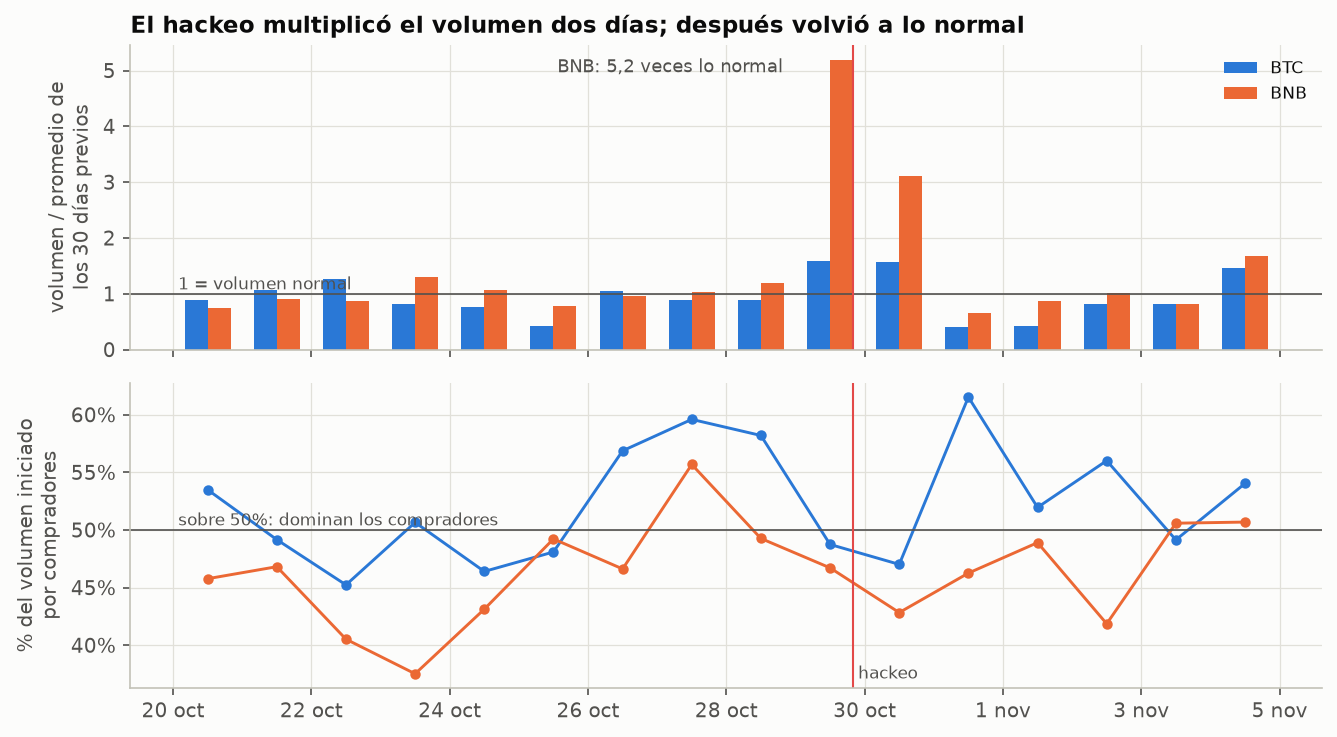
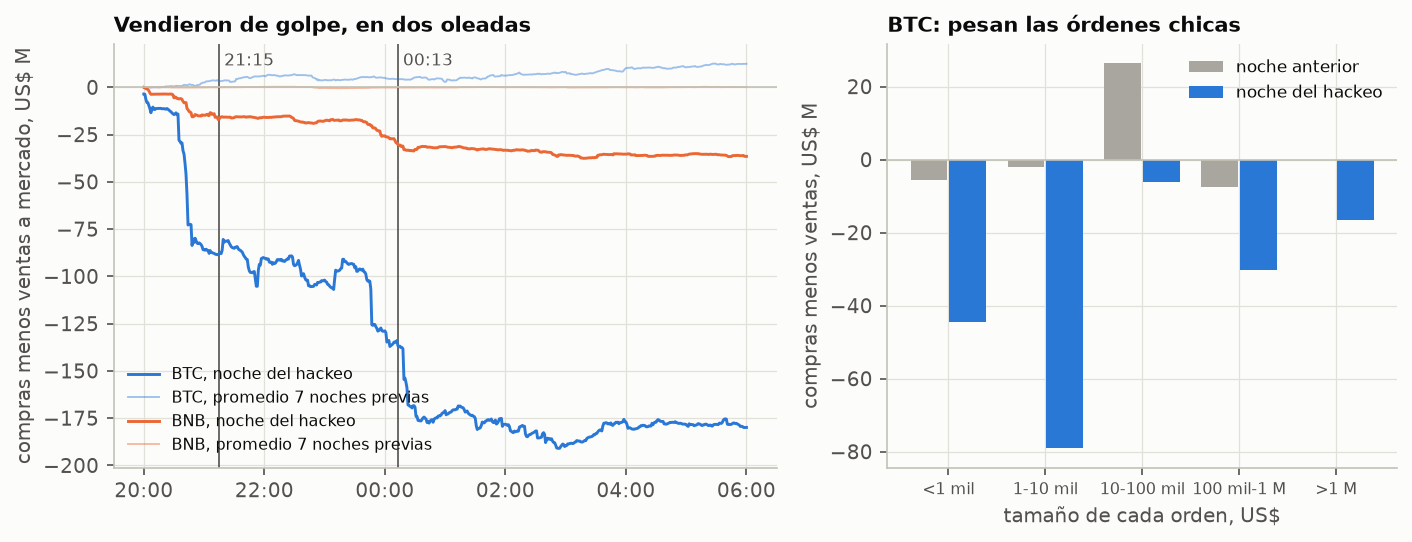
El volumen de BNB fue 5,2 veces lo normal el 29 de octubre, y a los dos días ya había vuelto a su nivel. Esa noche se vendieron a mercado 176 millones de dólares más de BTC de los que se compraron, y 70% vino de órdenes de menos de 10,000 dólares.
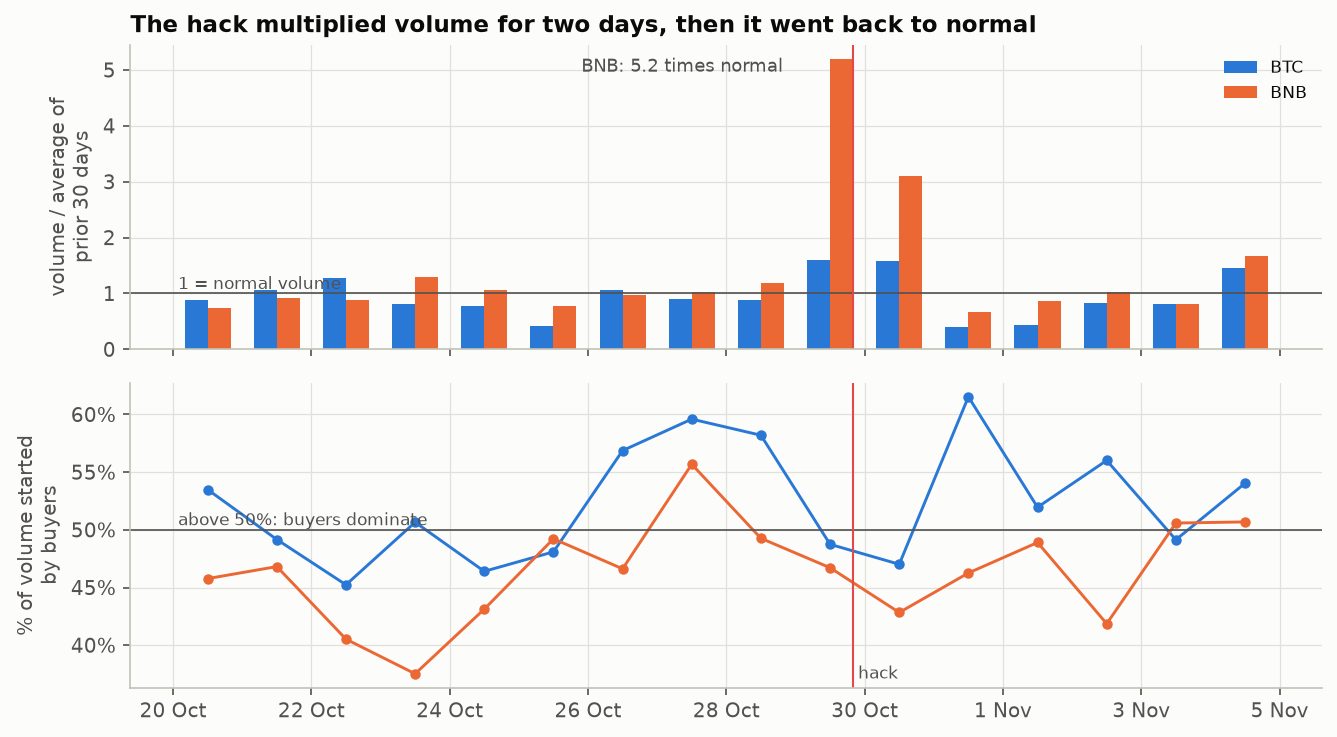
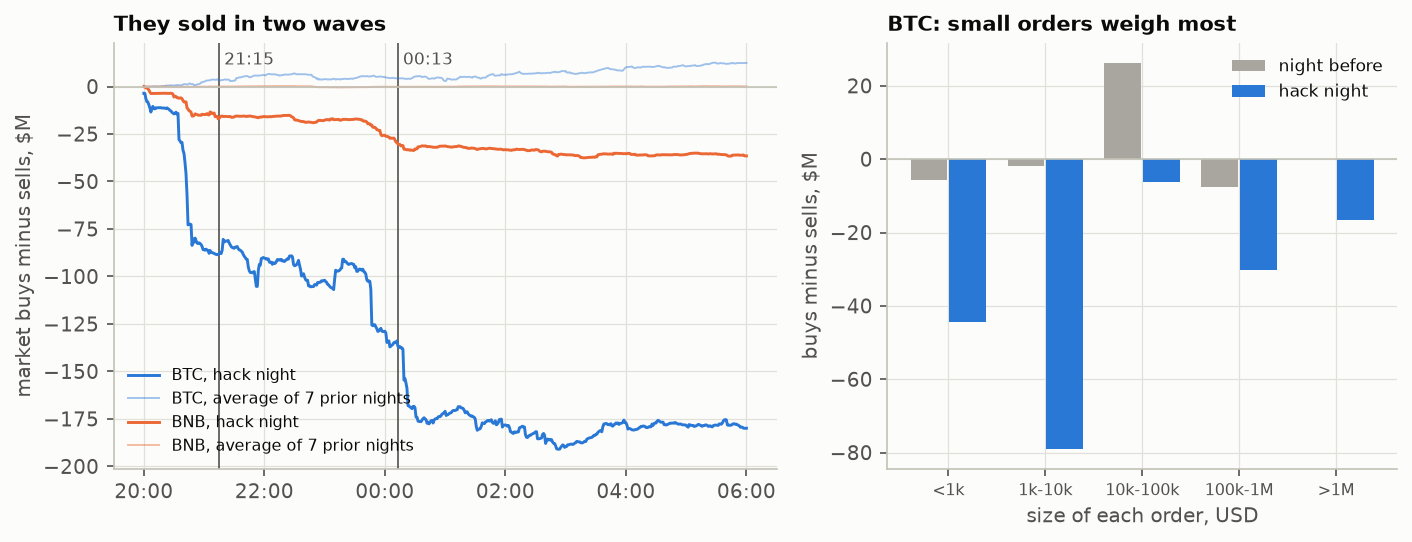
BNB's volume was 5.2 times normal on 29 October, and two days later it was back at its usual level. That night $176 million more BTC was sold at market than bought, 70% of it in orders under $10,000.
06¿Hubo una corrida contra Binance?Was there a run on Binance?
Sí, pero ordenada. Al reabrir, los clientes sacaron 8,7 mil millones de dólares en dos días, 6,0% de lo que había. Mientras los retiros estuvieron cerrados, Binance quedó apenas 0,09% más caro que Coinbase: el mercado no temió una quiebra.
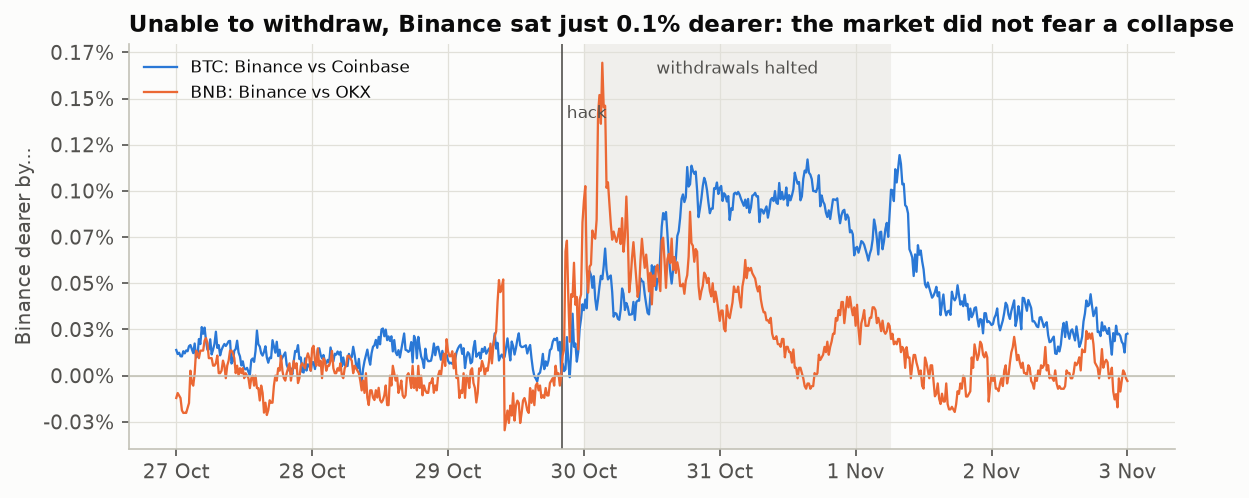
Yes, but an orderly one. After reopening, customers took out $8.7 billion in two days, 6.0% of holdings. While withdrawals were halted, Binance sat just 0.09% above Coinbase: the market did not fear a collapse.
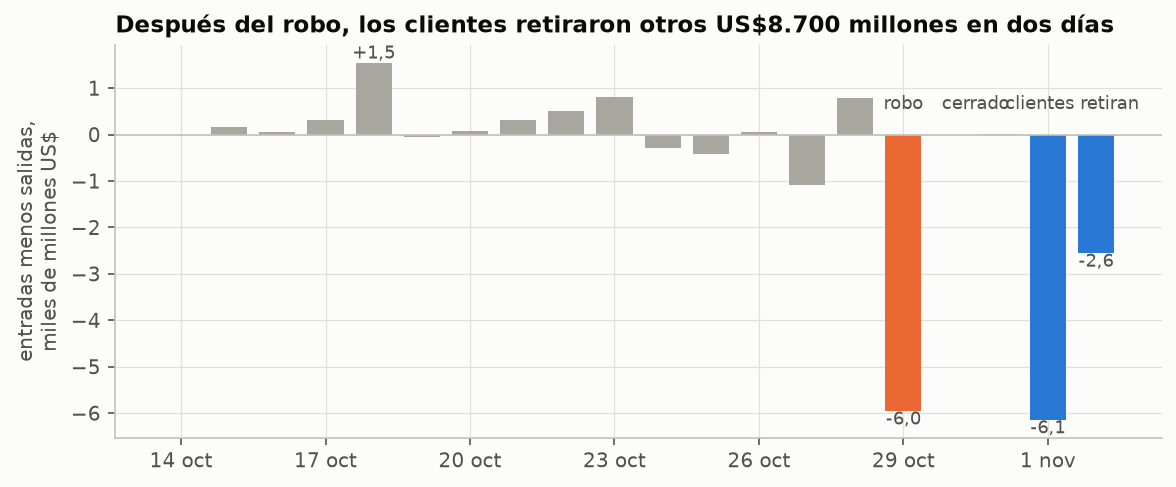
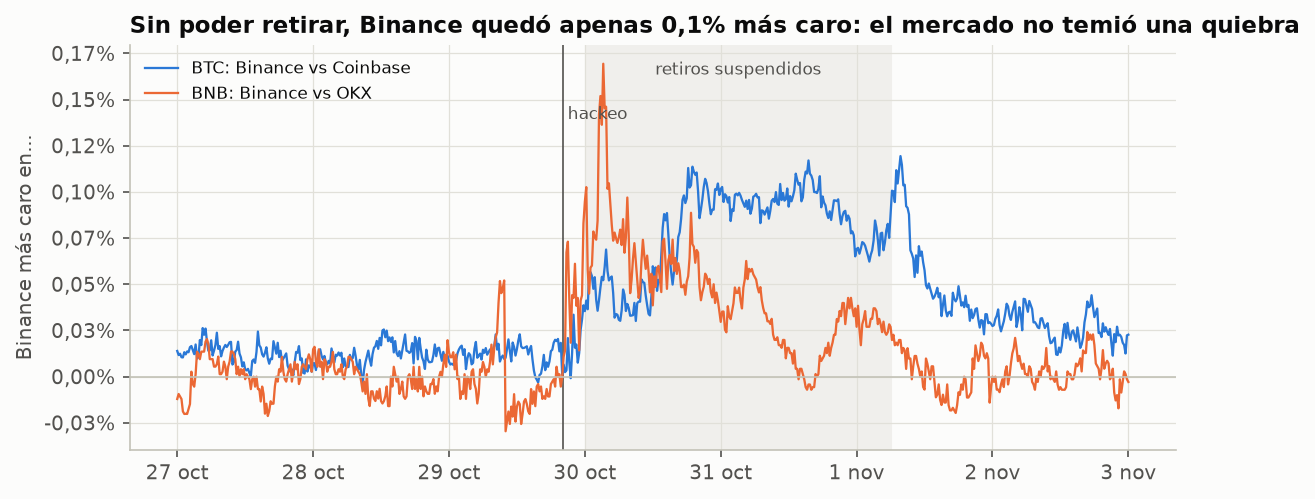
Mediana BTC contra Coinbase: +0,09% con retiros cerrados y +0,01% la semana previa. El flujo del día del robo fue -5,95 mil millones.
Median BTC against Coinbase: +0.09% with withdrawals halted and +0.01% the week before. The flow on the day of the theft was $-5.95 billion.
07¿Y las acciones de empresas cripto?And the shares of crypto companies?
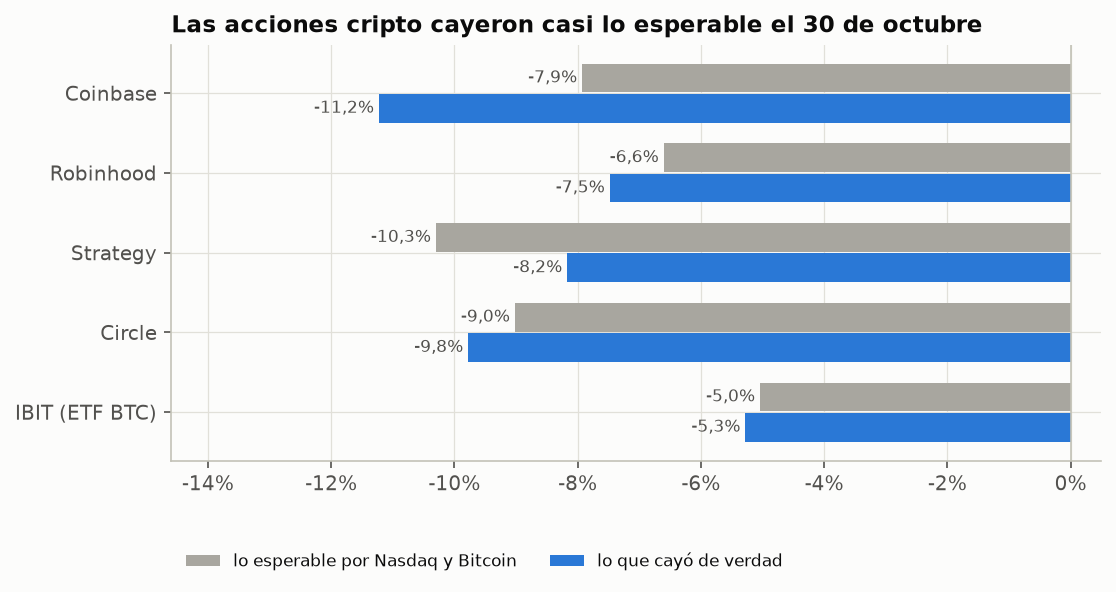
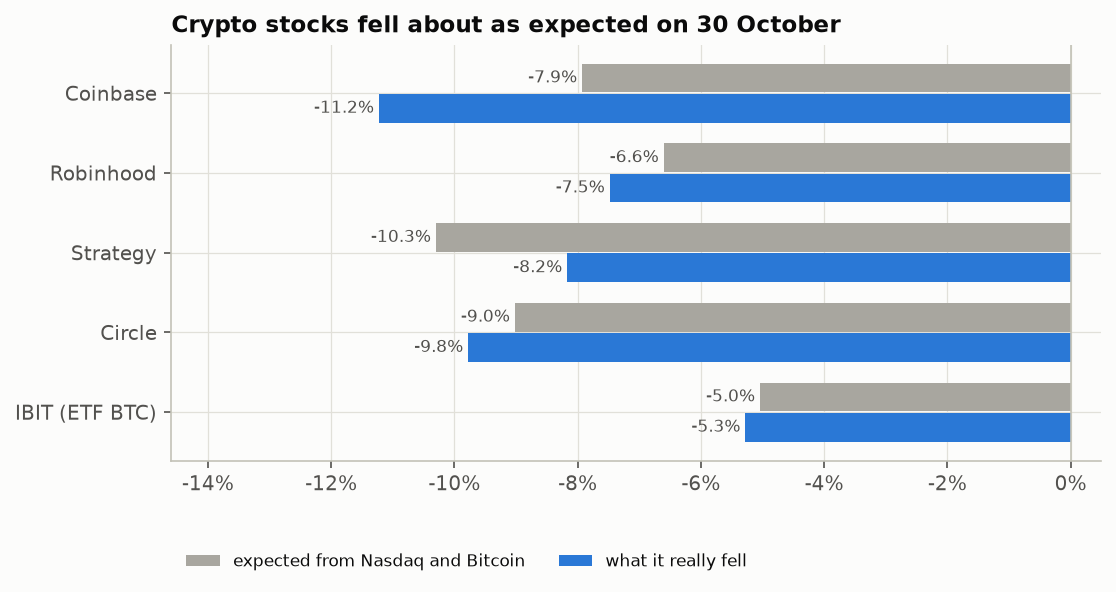
Cayeron fuerte, pero casi lo esperable: Coinbase perdió 11,2% un día en que el Nasdaq-100 y Bitcoin también caían. Ni contagio extra ni fuga de clientes hacia el competidor regulado.
They fell hard, but about as expected: Coinbase lost 11.2% on a day when the Nasdaq-100 and Bitcoin were falling too. No extra contagion, and no flight to the regulated competitor.
| Stock | Return Oct 30 | Beyond expected | t (beyond ±2 is unusual) |
|---|---|---|---|
| Acción | Retorno 30 oct | Más allá de lo esperado | t (más allá de ±2 es inusual) |
| COIN | -11.2% | -3.3% | -1.2 |
| HOOD | -7.5% | -0.9% | -0.2 |
| MSTR | -8.2% | +2.1% | +0.7 |
| CRCL | -9.8% | -0.8% | -0.2 |
08¿Qué pasa una semana, un mes o un año después?What happens a week, a month or a year later?
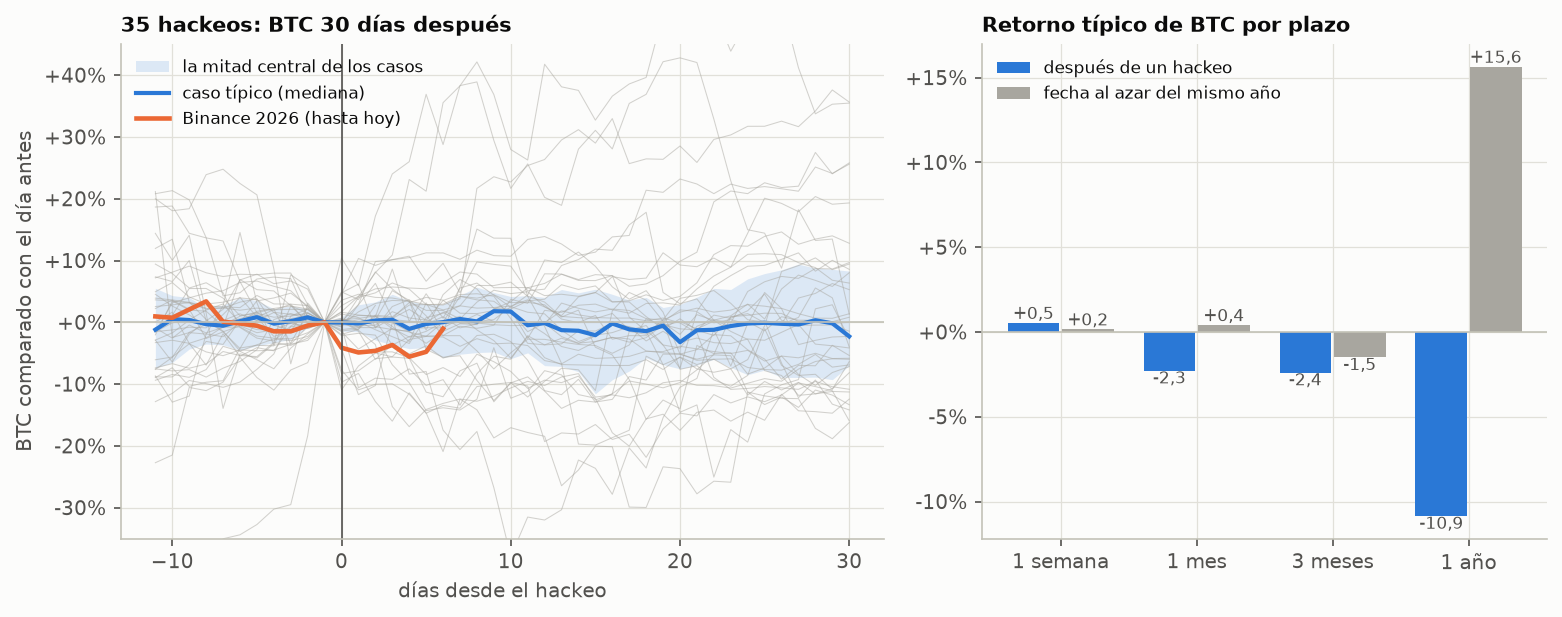
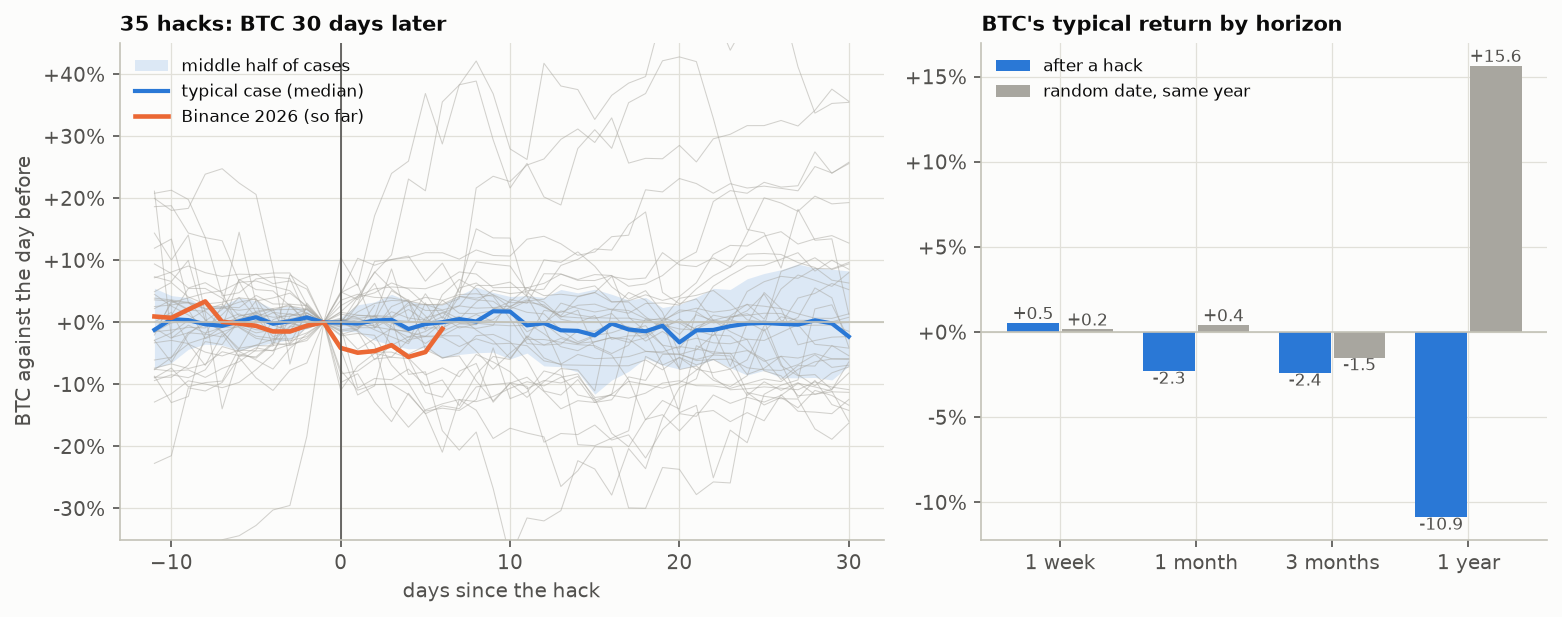
Este hackeo es demasiado reciente para saberlo, pero 35 anteriores sí se pueden medir. A una semana y a un mes, BTC no se distingue de una fecha cualquiera. A un año queda en -10,9% contra +15,6% de una fecha al azar del mismo año, una brecha grande pero no concluyente (p = 0,12), y muchos otros eventos caben en un año.
This hack is too recent to tell, but 35 earlier ones can be measured. At a week and a month, BTC cannot be told from any other date. At a year it stands at -10.9% against +15.6% for a random date of the same year, a large but inconclusive gap (p = 0.12), and many other events fit in a year.
| Horizon | After a hack (median) | Random date, same year | Share that rose | p (under 0.05 is clear) | Only hacks of $250M+ |
|---|---|---|---|---|---|
| Plazo | Tras un hackeo (mediana) | Fecha al azar, mismo año | Parte que subió | p (bajo 0,05 es claro) | Solo hackeos de US$250 M+ |
| 1 semana1 week | +0.5% | +0.2% | 51% | 0.78 | -2.2% |
| 1 mes1 month | -2.3% | +0.4% | 43% | 0.32 | -8.2% |
| 3 meses3 months | -2.4% | -1.5% | 47% | 0.89 | +0.2% |
| 1 año1 year | -10.9% | +15.6% | 48% | 0.12 | +11.1% |
¿Cuánto tardó BTC en volver al precio previo tras los grandes hackeos? En 10 de 13 casos, menos de un mes. Las excepciones (Mt. Gox 2014 y BitMart 2021) coinciden con mercados bajistas largos.
How long did BTC take to regain its earlier price after the big hacks? In 10 of 13 cases, under a month. The exceptions (Mt. Gox 2014 and BitMart 2021) coincide with long bear markets.
| Date | Exchange | Stolen, $M | Days to recover |
|---|---|---|---|
| Fecha | Exchange | Robado, US$ M | Días en recuperar |
| 2014-02-07 | Mt. Gox | 470 | 861 |
| 2018-01-26 | Coincheck | 534 | 2 |
| 2018-02-12 | BitGrail | 170 | 0 |
| 2018-04-21 | Gate | 235 | 1 |
| 2020-09-29 | KuCoin | 281 | 0 |
| 2021-12-04 | BitMart | 196 | 815 |
| 2022-11-12 | FTX | 450 | 19 |
| 2023-11-10 | Poloniex | 126 | 0 |
| 2024-05-31 | DMM Bitcoin | 305 | 4 |
| 2024-07-18 | WazirX: India | 235 | 2 |
| 2025-02-21 | Bybit | 1,400 | 77 |
| 2025-04-20 | Bitget | 100 | 0 |
| 2026-09-24 | Bitget | 387 | 1 |
09¿Cómo se ve esto año por año?How does this look year by year?
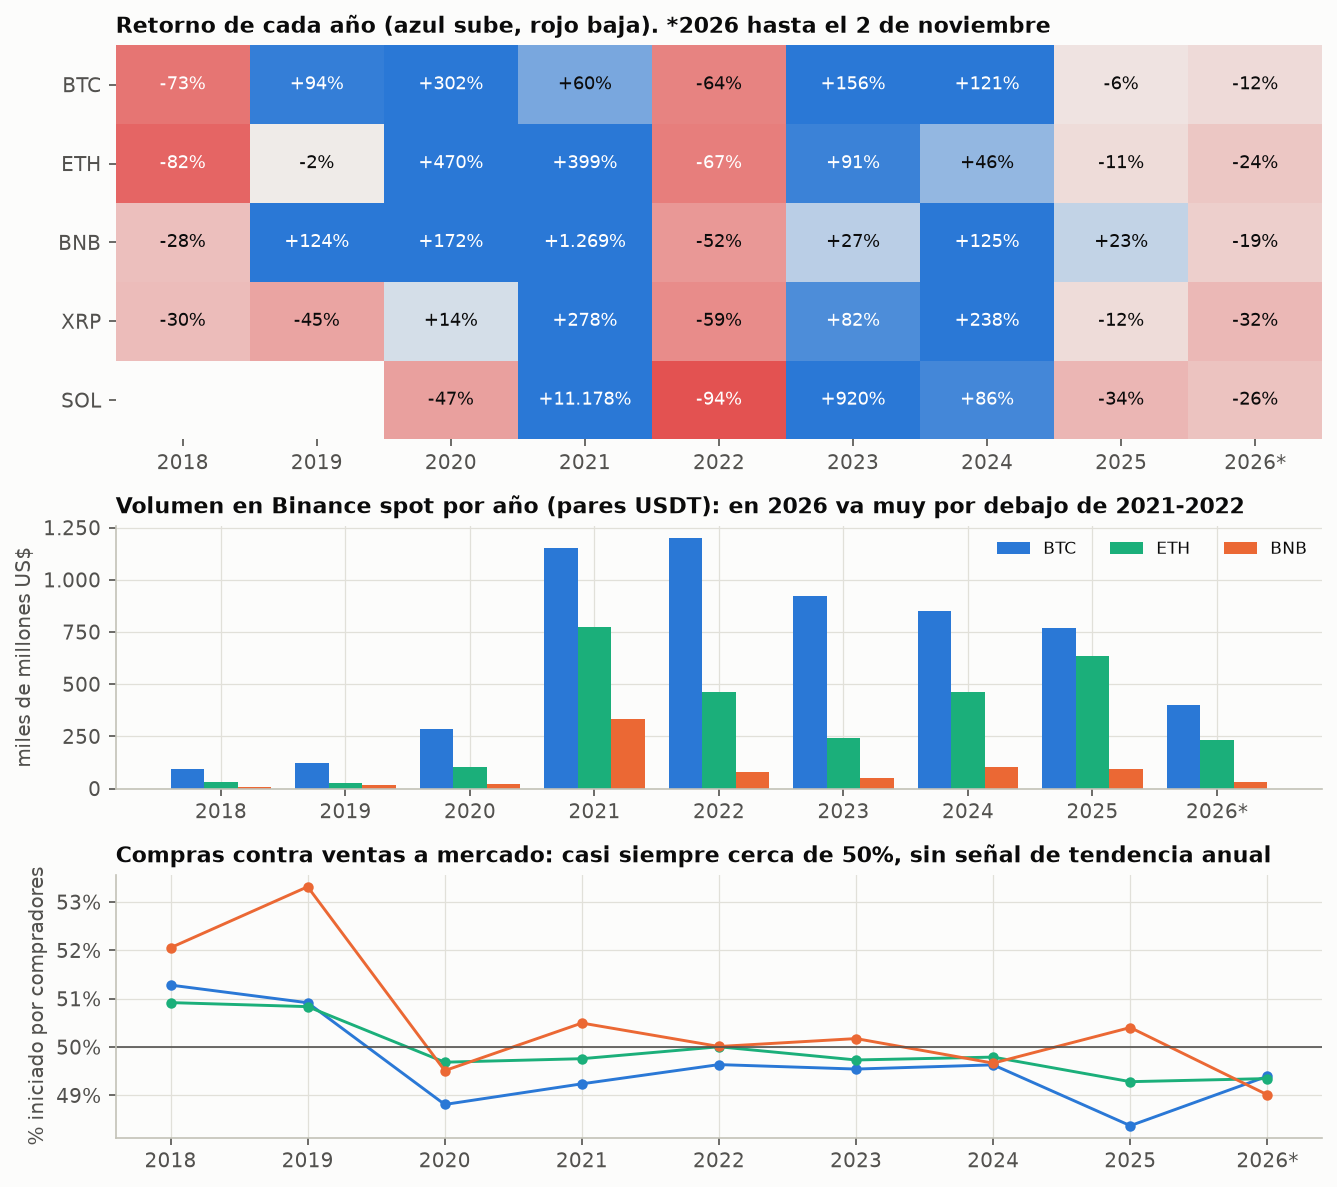
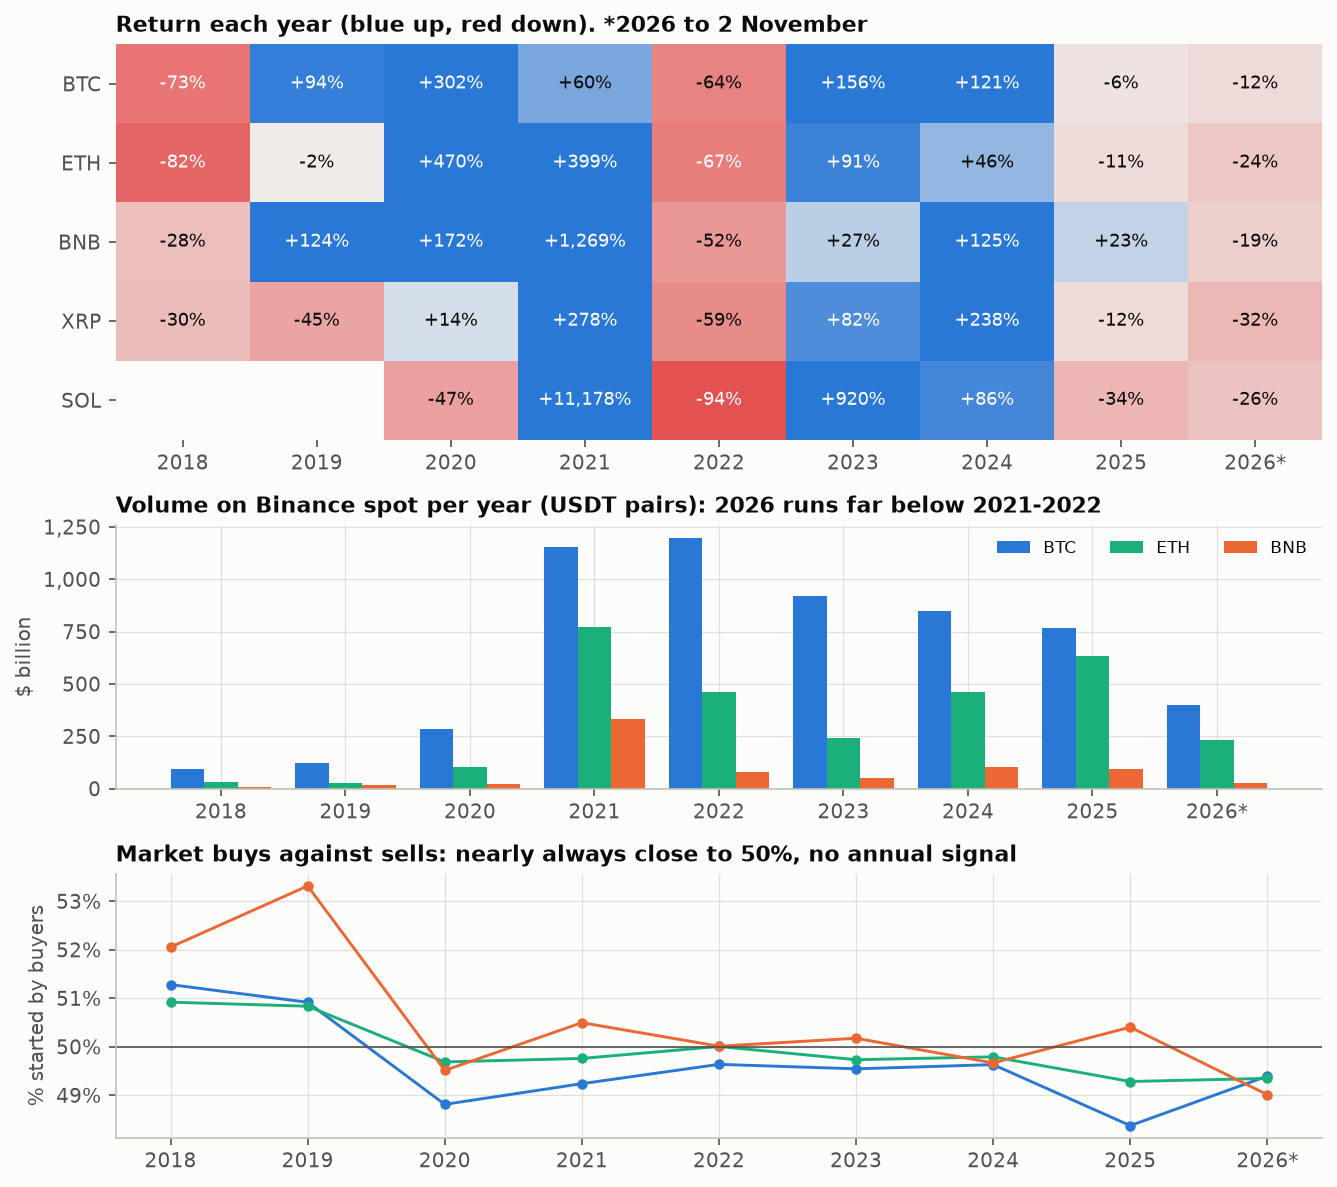
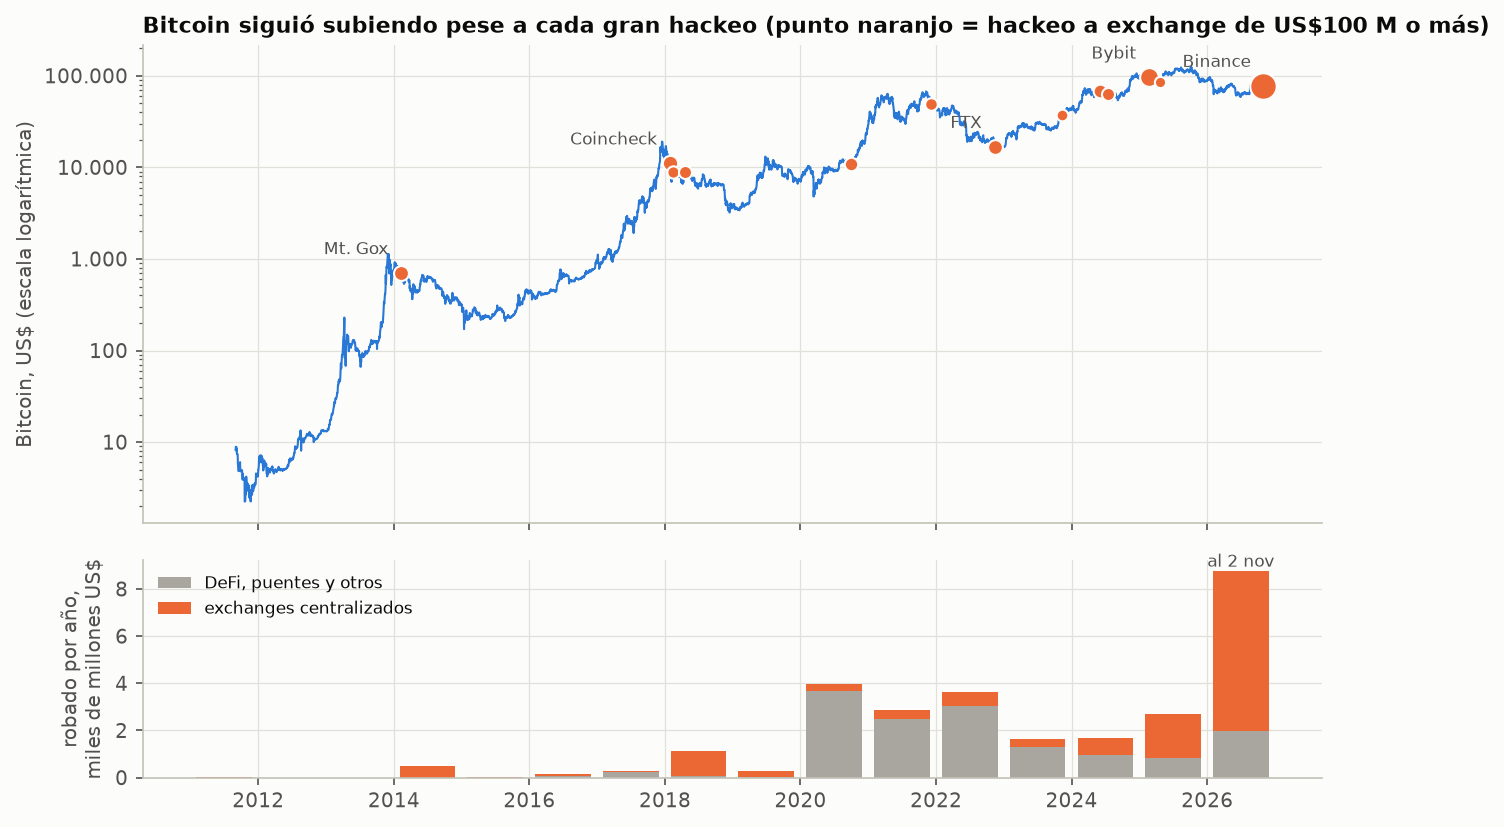
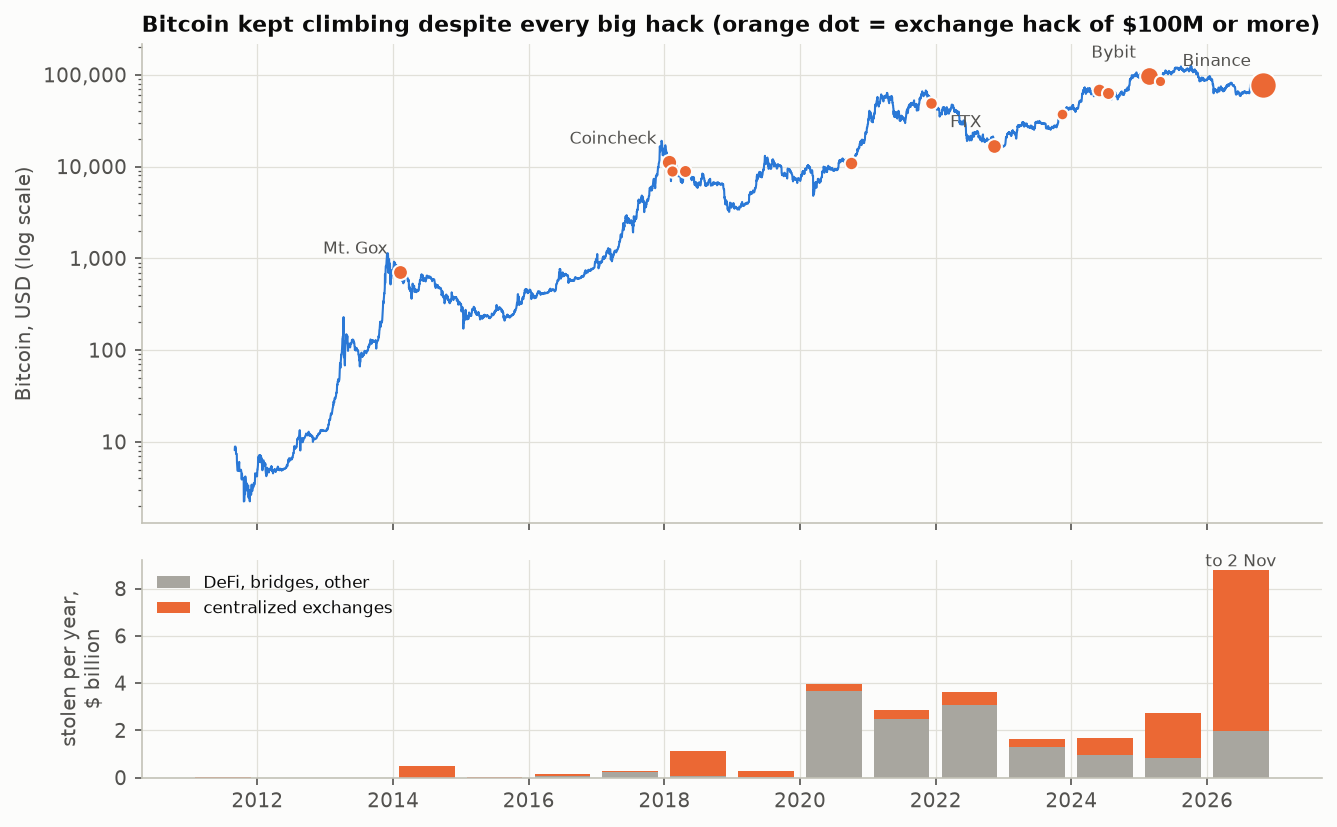
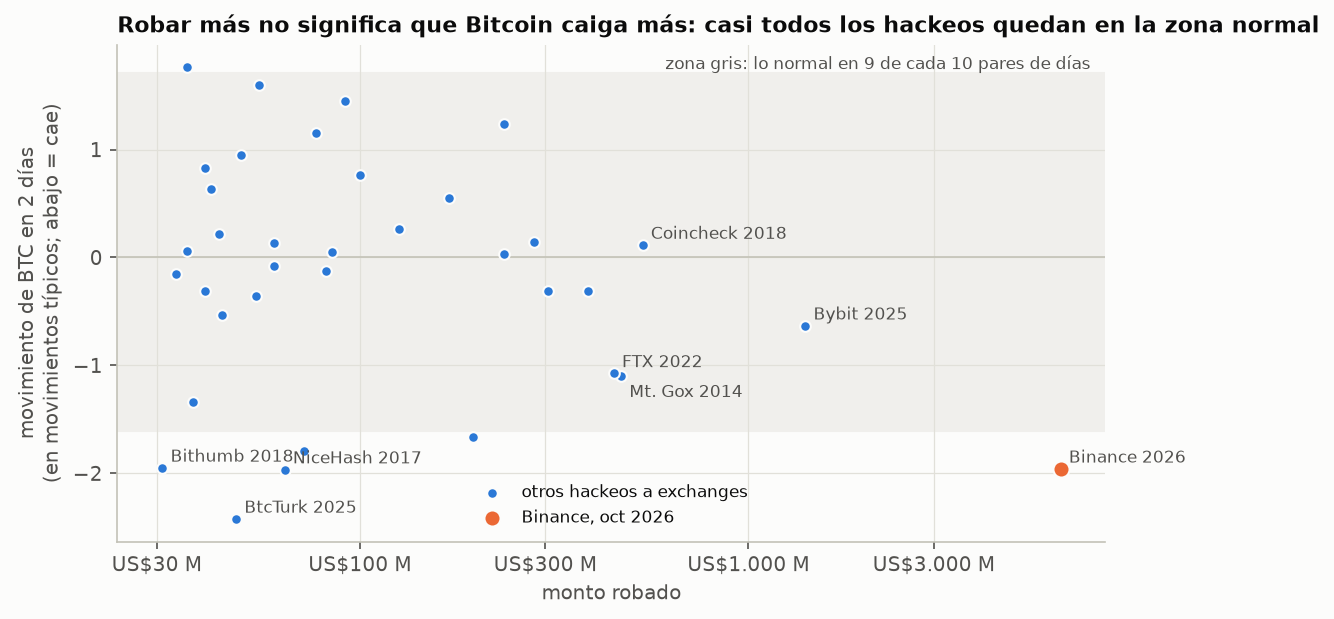
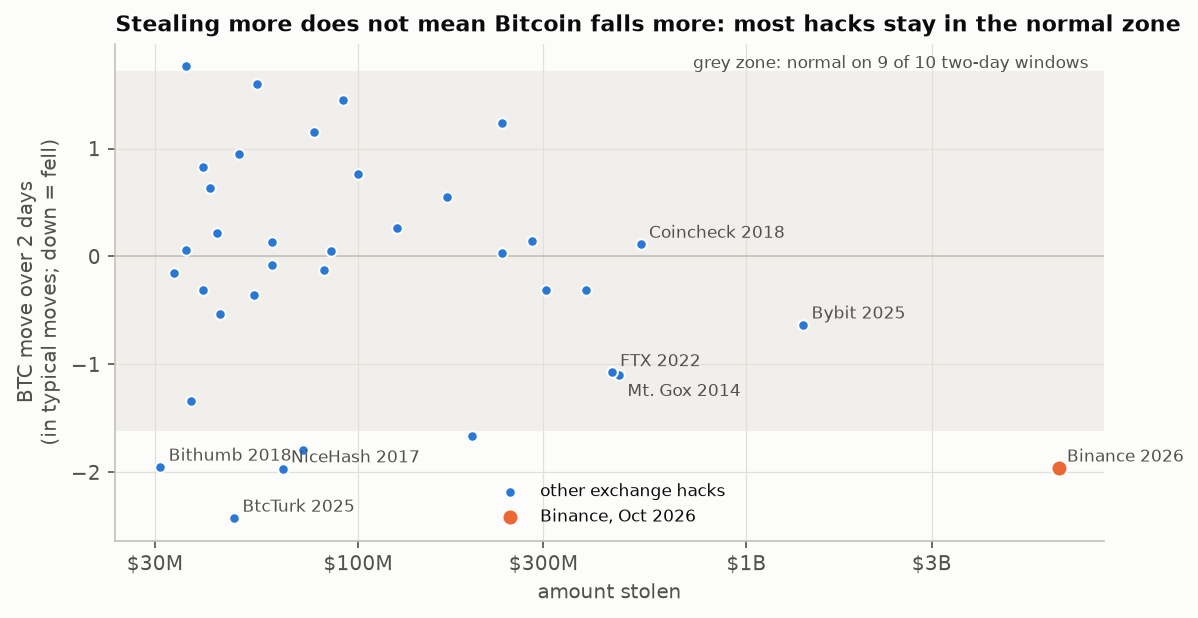
2026 ya es el peor año registrado en robos, con 8,78 mil millones de dólares, y Binance es la mayor parte. Aun así, en 36 hackeos a exchanges desde 2011 el efecto promedio sobre Bitcoin no se distingue del azar (p = 0,15). Este es el 3° mayor de esos 36.
2026 is already the worst year on record for theft, with $8.78 billion, and Binance is most of it. Even so, across 36 exchange hacks since 2011 the average effect on Bitcoin cannot be told from chance (p = 0.15). This one ranks 3 of those 36.
10¿De verdad venía subiendo? La guerra y la macroWas it really rising? The war and the macro
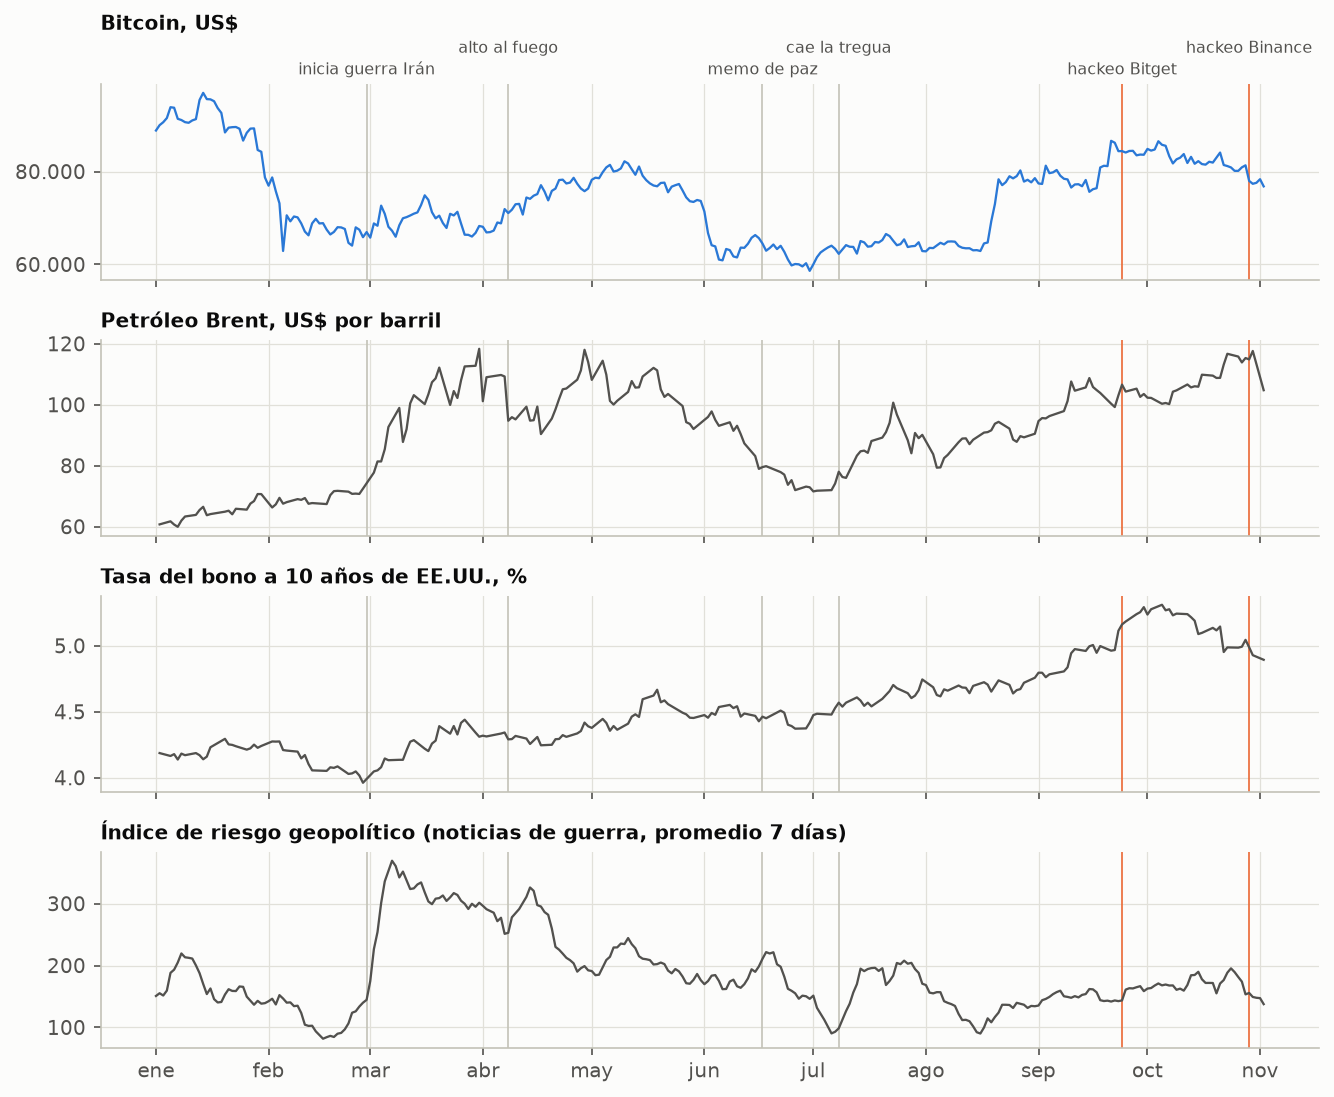
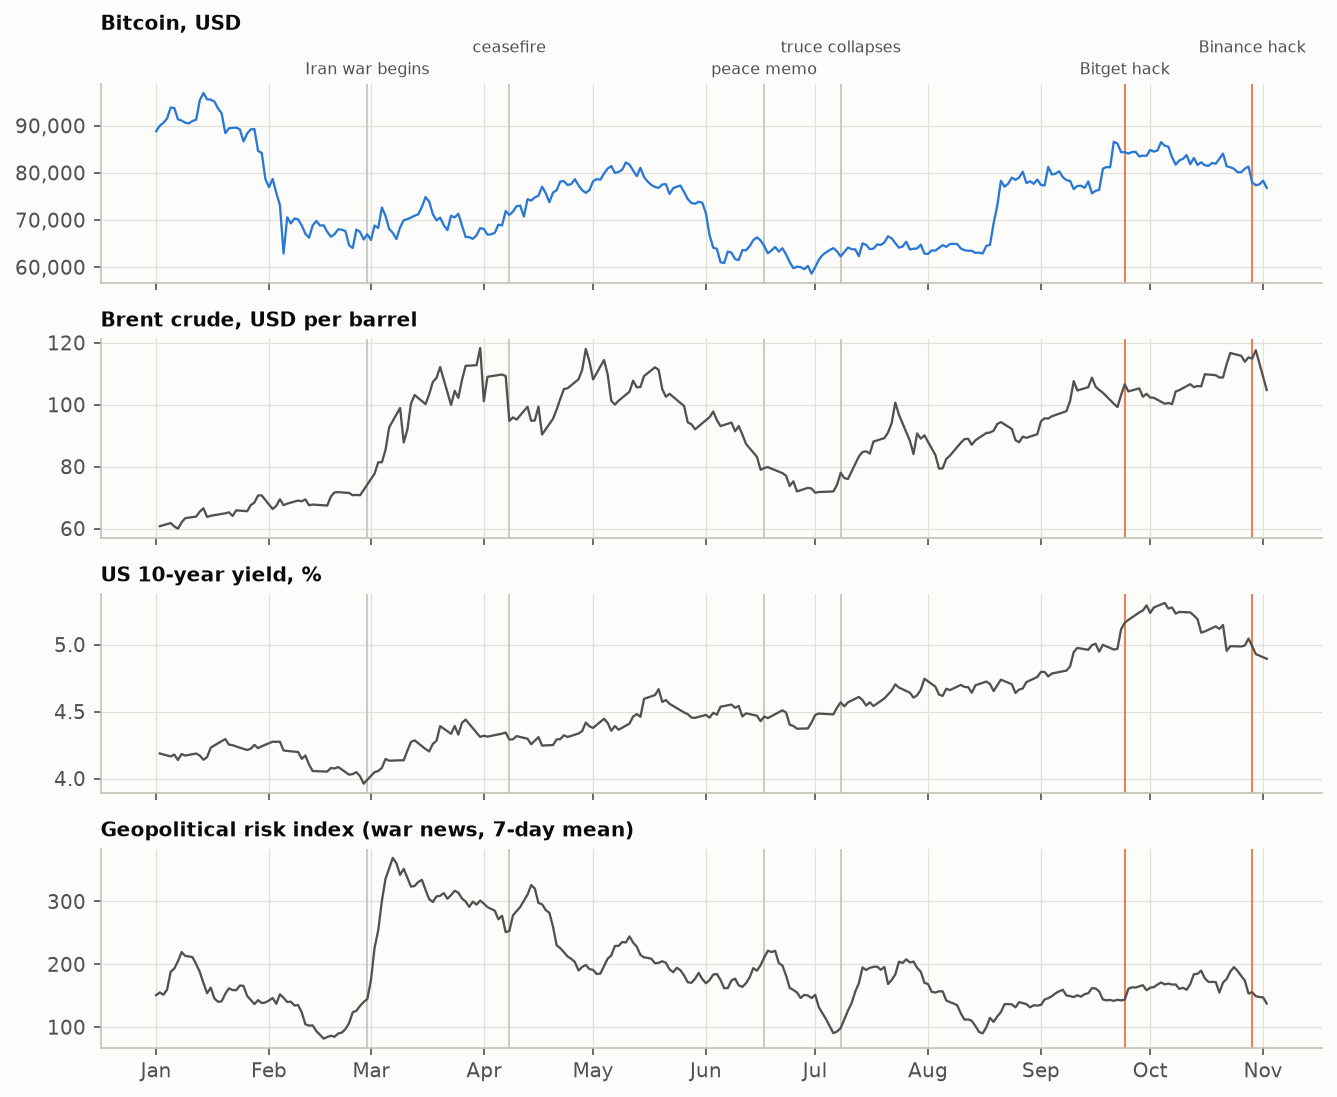
A medias. BTC subió 43% en el tercer trimestre, pero justo antes del hackeo ya iba -2,7% en octubre y 16% bajo su máximo de enero. El ambiente ya era duro: guerra con Irán, Brent sobre 110 dólares y la tasa a 10 años de EE.UU. cerca de 5%.
Partly. BTC rose 43% in the third quarter, but just before the hack it was already -2.7% in October and 16% below its January high. The backdrop was already harsh: war with Iran, Brent above $110 and the US 10-year yield near 5%.
11¿Se puede predecir el precio con noticias y machine learning?Can news and machine learning predict the price?
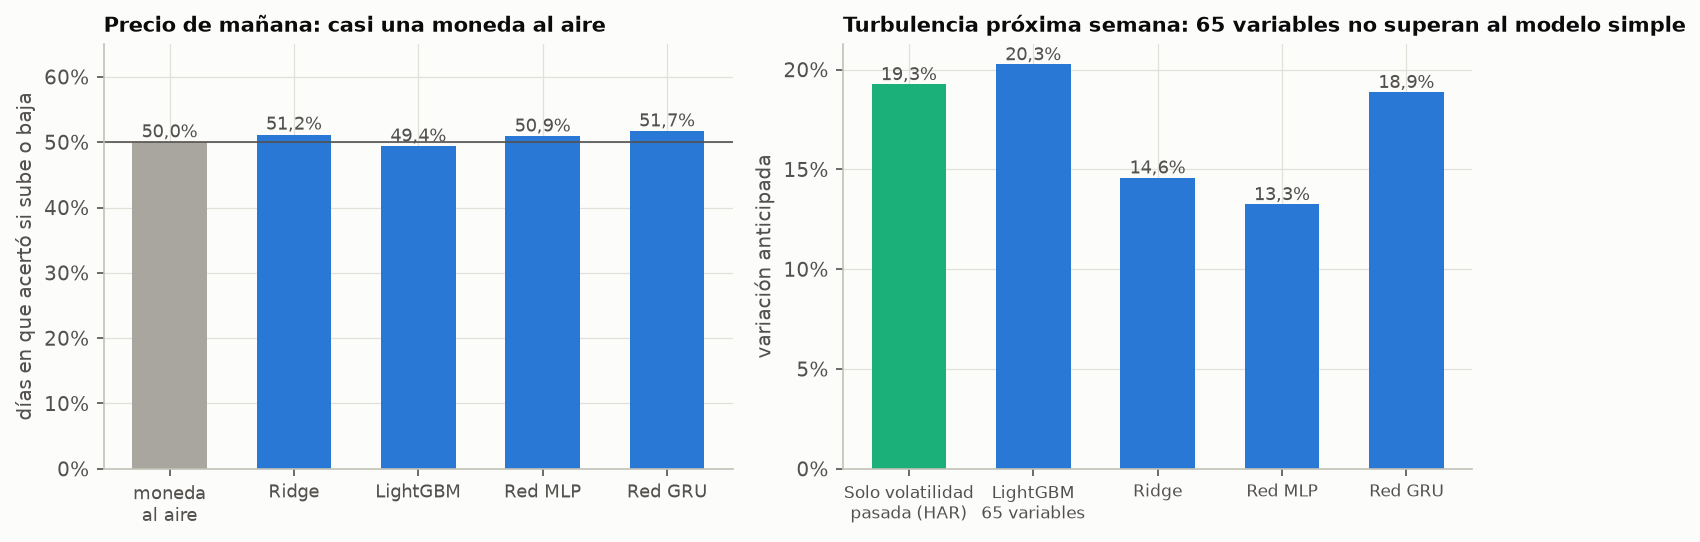
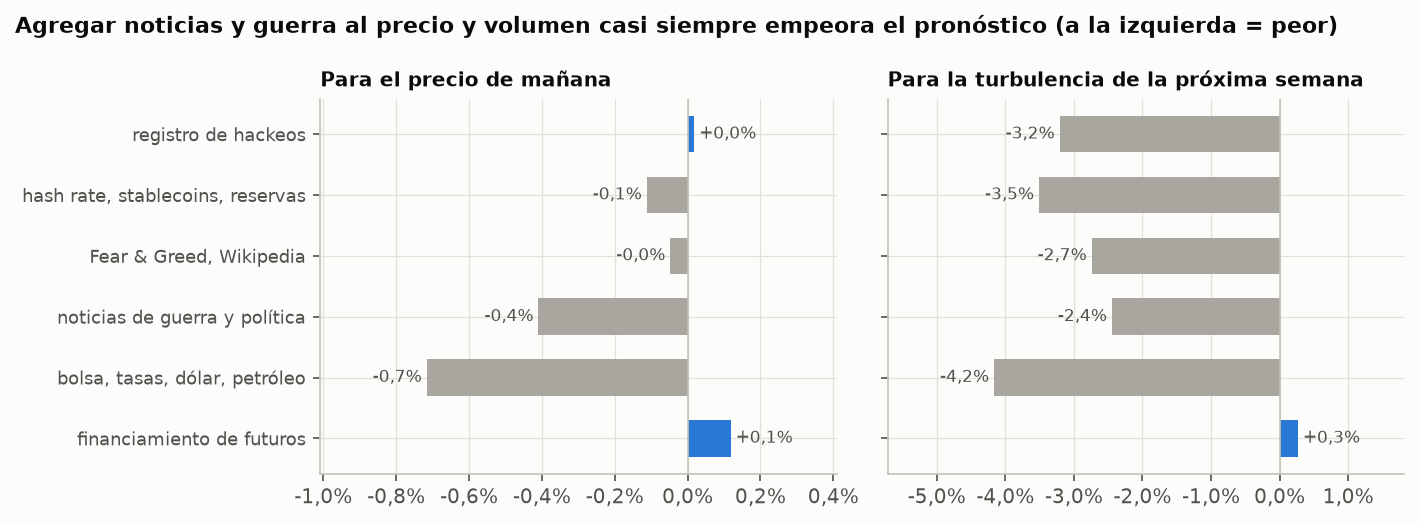
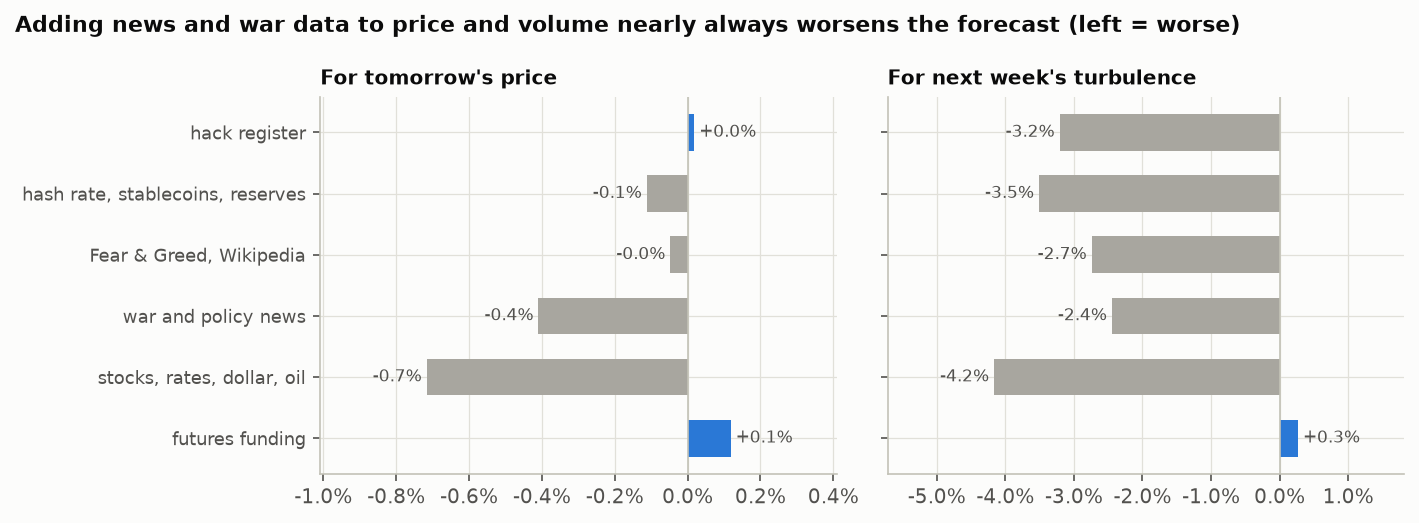
El precio de mañana, no. Probé cinco modelos con 65 variables, incluida la guerra y las noticias, reentrenados de 2022 a 2026 sin mirar el futuro: ninguno le gana a decir "queda igual". La turbulencia de la próxima semana sí se anticipa en parte, y para eso basta la volatilidad pasada.
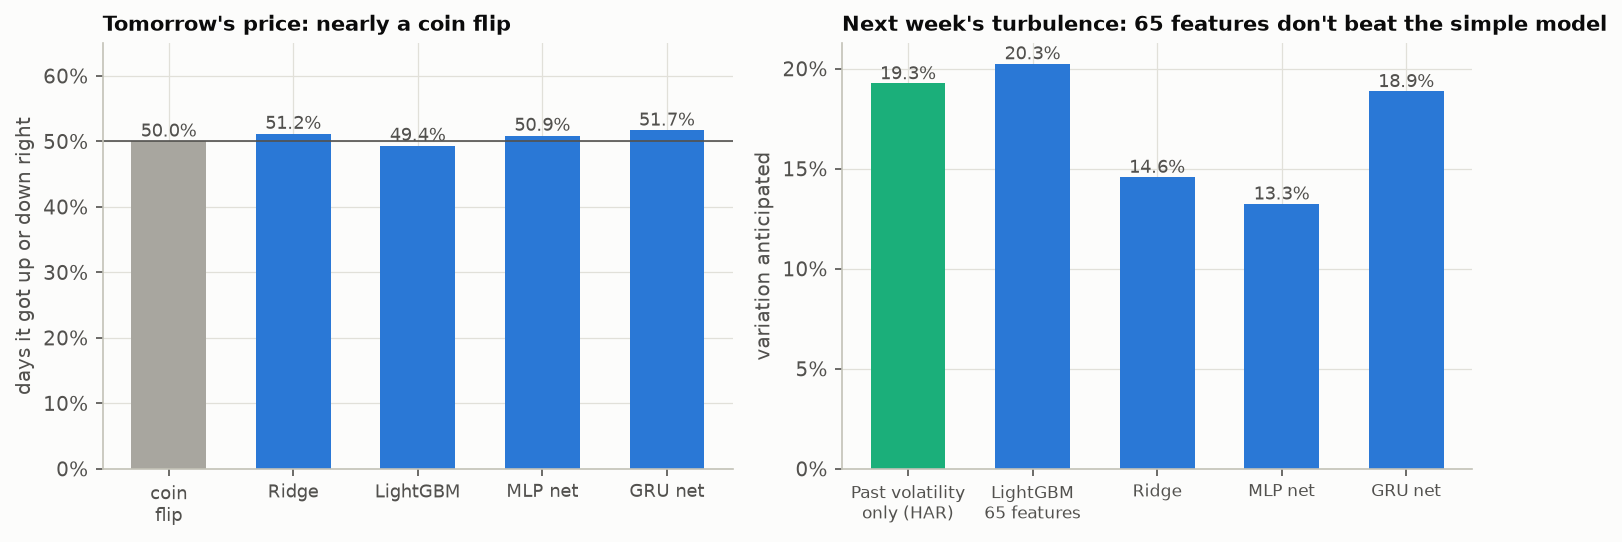
Tomorrow's price, no. I tried five models with 65 features, including war and news, refitted from 2022 to 2026 without looking ahead: none beats saying "no change". Next week's turbulence can be partly anticipated, and past volatility alone is enough for that.
| Target | Benchmark | LightGBM | Ridge | MLP | GRU (100+ epochs) |
|---|---|---|---|---|---|
| Objetivo | Referencia | LightGBM | Ridge | MLP | GRU (100+ épocas) |
| Retorno mañana (R²)Next-day return (R²) | 0% = "queda igual"0% = "no change" | -0.6% | -1.1% | -1.4% | -1.7% |
| Retorno 7 días (R²)7-day return (R²) | 0% = "queda igual"0% = "no change" | -2.0% | -3.8% | -12.3% | |
| Turbulencia semana (R²)Next-week turbulence (R²) | HAR 19.3% | 20.3% | 14.6% | 13.3% | 18.9% |
El GRU entrena al menos 100 épocas por ciclo, con early stopping desde ahí, y su mejor punto queda casi siempre pegado a la época 100 (mediana 102): entrenar más no agrega nada. LightGBM mejora a HAR en 1,2%, sin significancia (p = 0,28). Una estrategia de comprar o salir según el modelo pierde contra mantener en las cinco monedas.
The GRU trains at least 100 epochs per cycle, with early stopping from there, and its best point nearly always sits at epoch 100 (median 102): more training adds nothing. LightGBM beats HAR by 1.2%, not significantly (p = 0.28). A strategy of buying or leaving on the model's signal loses to holding on all five coins.
12¿Hacia dónde puede ir el precio?Where can the price go?
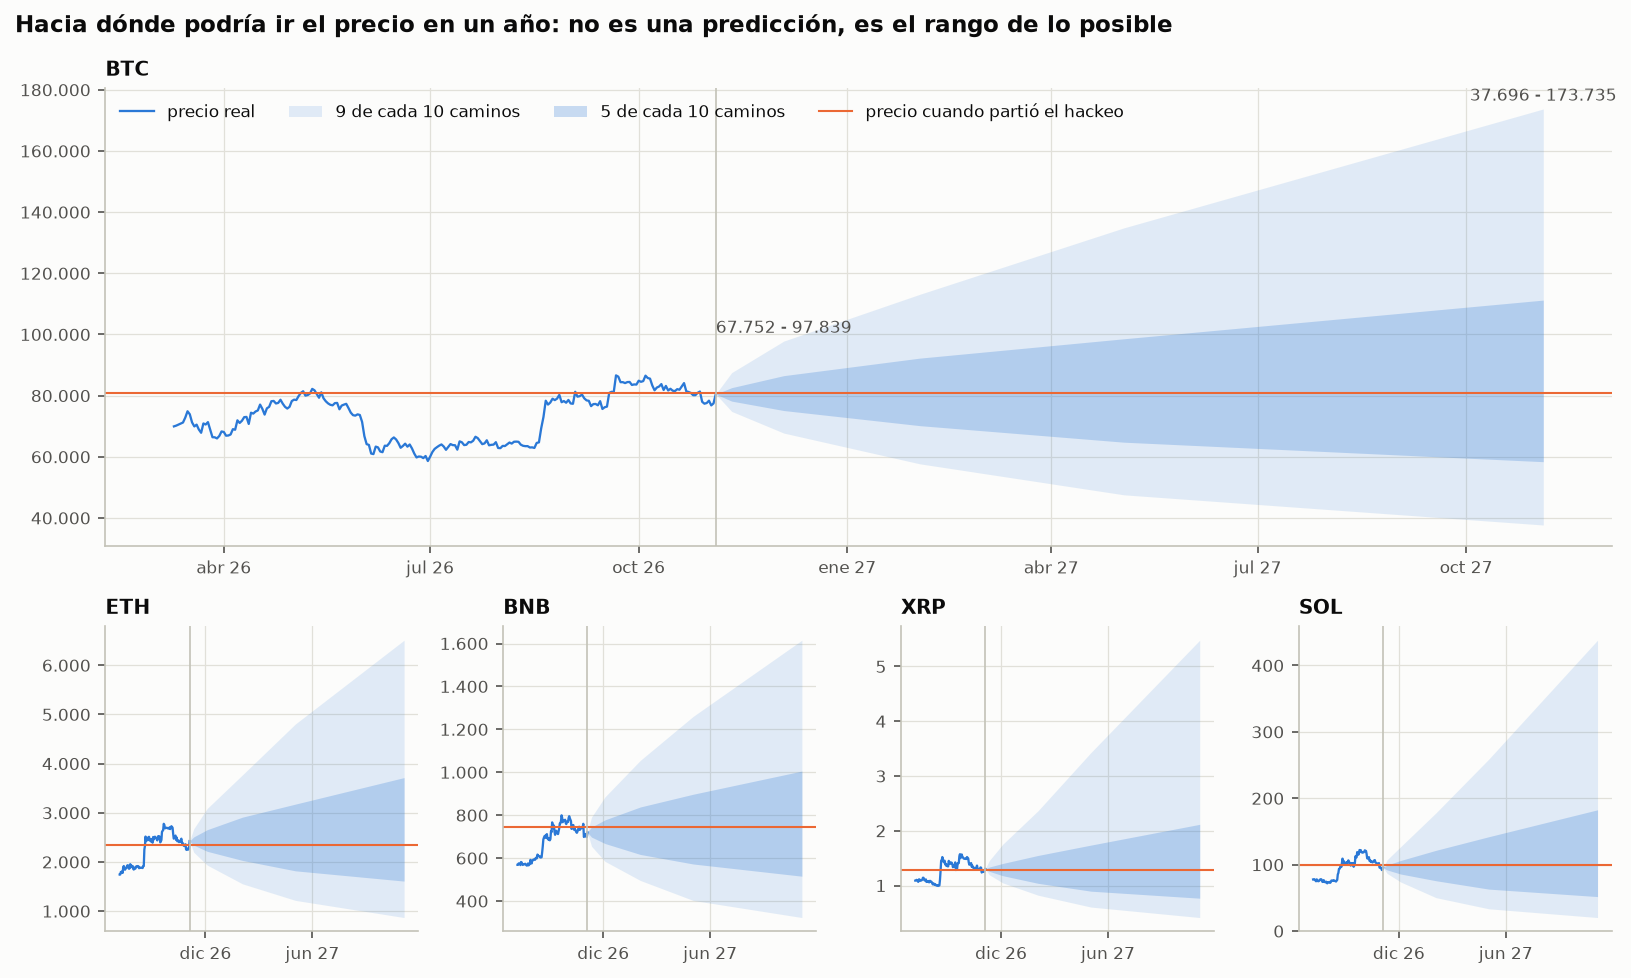
No hay un número confiable, pero sí un rango. Con los movimientos históricos de BTC, a un mes lo más probable es entre 67.752 y 97.839 dólares, y a un año entre 37.696 y 173.735. La amplitud es la conclusión: a esos plazos, casi cualquier cosa es posible.
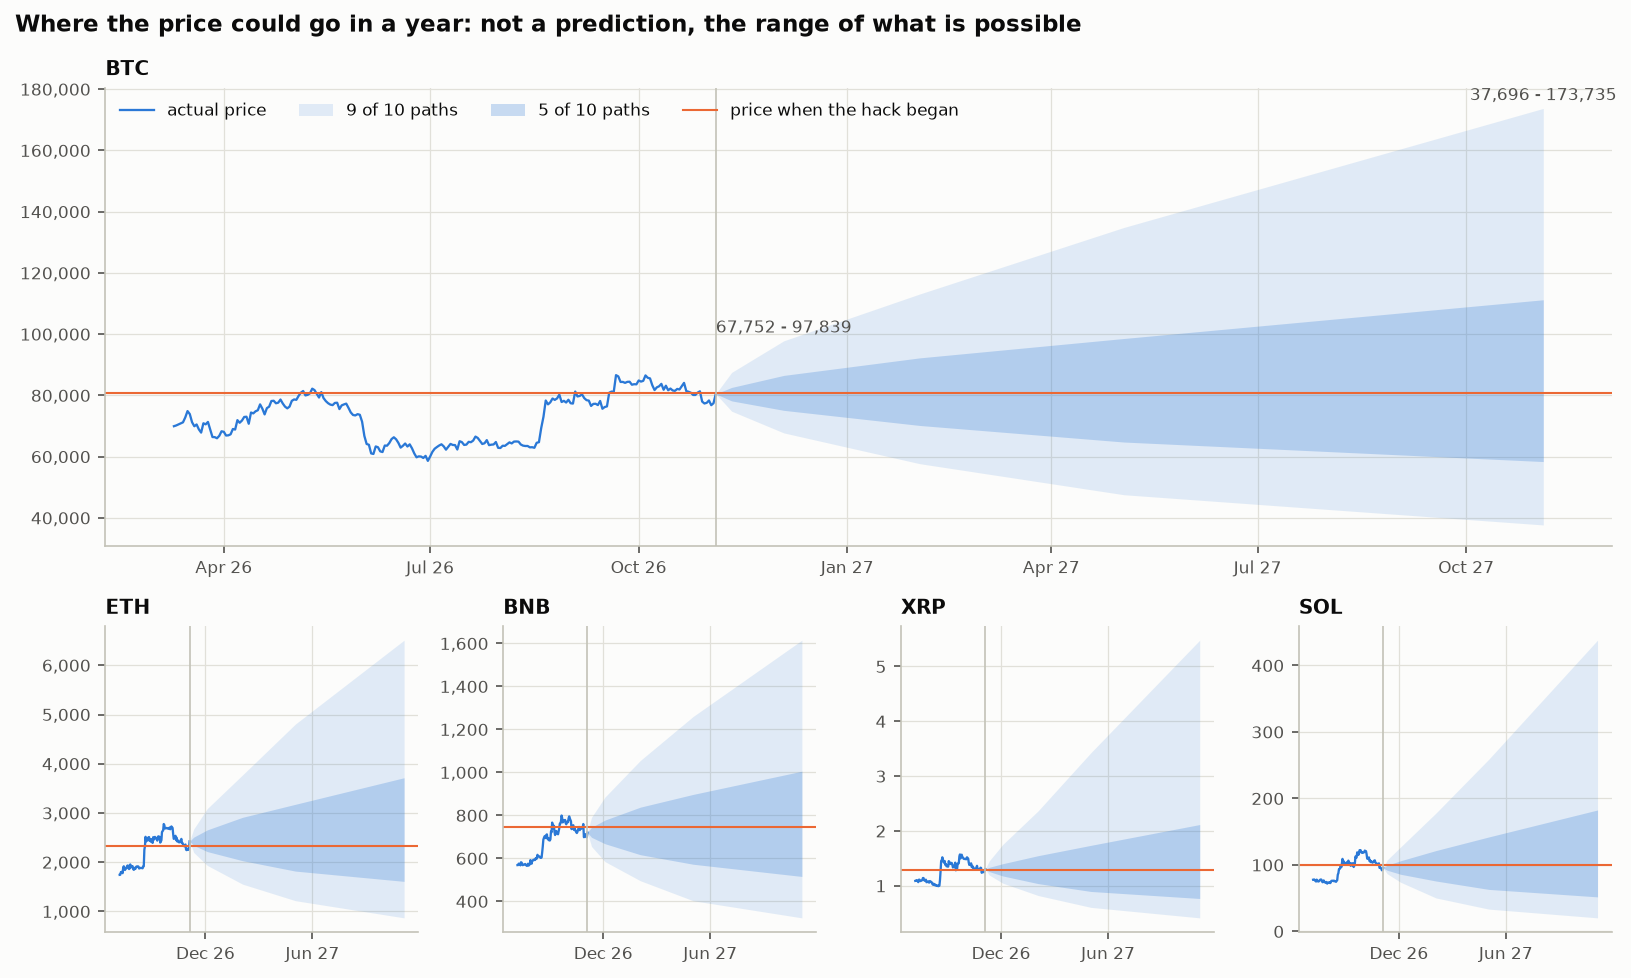
There is no reliable number, but there is a range. Using BTC's historical moves, at a month the likely range is $67,752 to $97,839, and at a year $37,696 to $173,735. The width is the conclusion: at those horizons, almost anything is possible.
| Coin | Last close | 7 days (90%) | 1 month (90%) | 3 months (90%) | 1 year (90%) | Chance above pre-hack price in 1 month |
|---|---|---|---|---|---|---|
| Moneda | Último cierre | 7 días (90%) | 1 mes (90%) | 3 meses (90%) | 1 año (90%) | Prob. sobre precio pre-hackeo en 1 mes |
| BTC | 80,504 | 74,844 - 87,522 | 67,752 - 97,839 | 57,702 - 113,136 | 37,696 - 173,735 | 48% |
| ETH | 2,425 | 2,198 - 2,674 | 1,936 - 3,089 | 1,555 - 3,772 | 869.61 - 6,510 | 61% |
| BNB | 719.99 | 655.32 - 791.05 | 584.71 - 885.61 | 495.94 - 1,055 | 323.15 - 1,615 | 38% |
| XRP | 1.3052 | 1.1959 - 1.4572 | 1.0483 - 1.7562 | 0.8241 - 2.3675 | 0.4164 - 5.4798 | 48% |
| SOL | 95.61 | 86.80 - 107.48 | 73.94 - 127.12 | 50.41 - 177.98 | 20.42 - 438.07 | 39% |
¿Se puede confiar en estos rangos? Lo probé desde cada inicio de mes desde 2020, usando solo datos anteriores. El rango de 90% acertó 84% a 7 días, 88% a un mes, 92% a tres meses y 88% a un año. Como no agrega tendencia, en ese período el precio terminó sobre la mediana 57% de las veces: es un poco pesimista cuando el mercado sube. A un año, esos resultados se solapan, así que hay pocos casos realmente independientes.
Can these ranges be trusted? I tested them from every month-start since 2020, using only earlier data. The 90% range held 84% at 7 days, 88% at a month, 92% at three months and 88% at a year. Since it adds no trend, the price ended above the median 57% of the time in that period: a little pessimistic when the market rises. At a year those results overlap, so there are few truly independent cases.
13¿Cómo le va al pronóstico de corto plazo?How is the short-term forecast doing?
Lo congelé con datos al 2026-11-02 para poder revisarlo honestamente. Sus medianas son casi "queda igual", así que lo útil es la banda: históricamente contuvo 89% de los movimientos a un día y 86% a 7 días. No vio venir el hackeo, y ninguna de las cinco monedas quedó dentro de la banda ese día.
I froze it with data to 2026-11-02 so it can be checked honestly. Its medians are almost "no change", so what is useful is the band: historically it contained 89% of one-day moves and 86% of 7-day ones. It did not see the hack coming, and none of the five coins stayed inside its band that day.
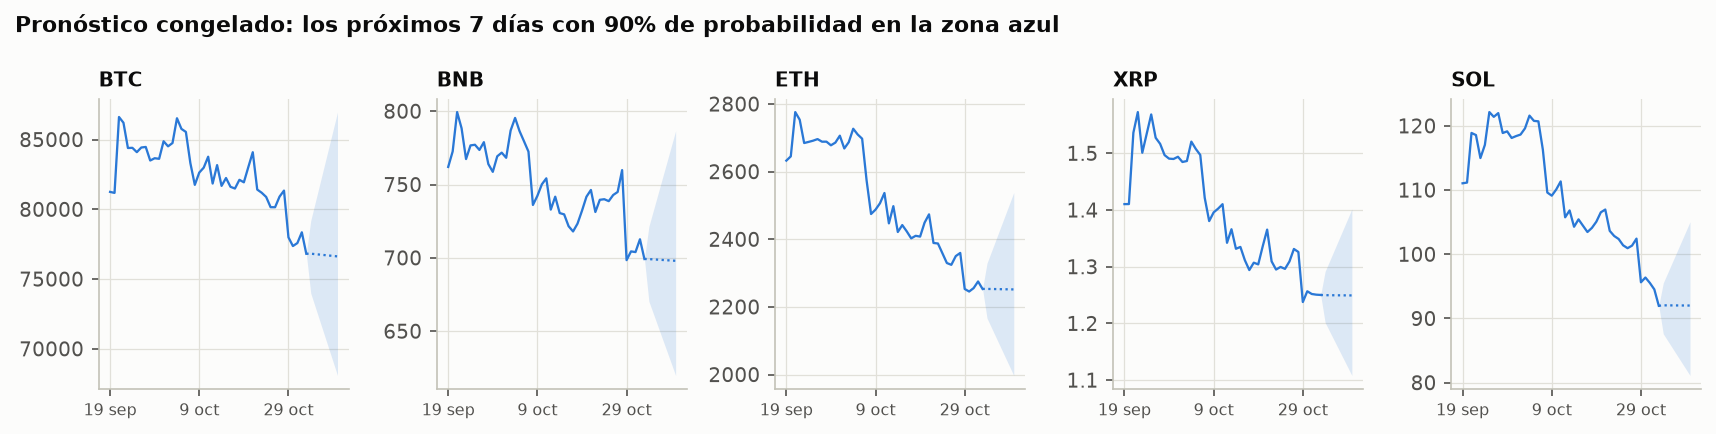
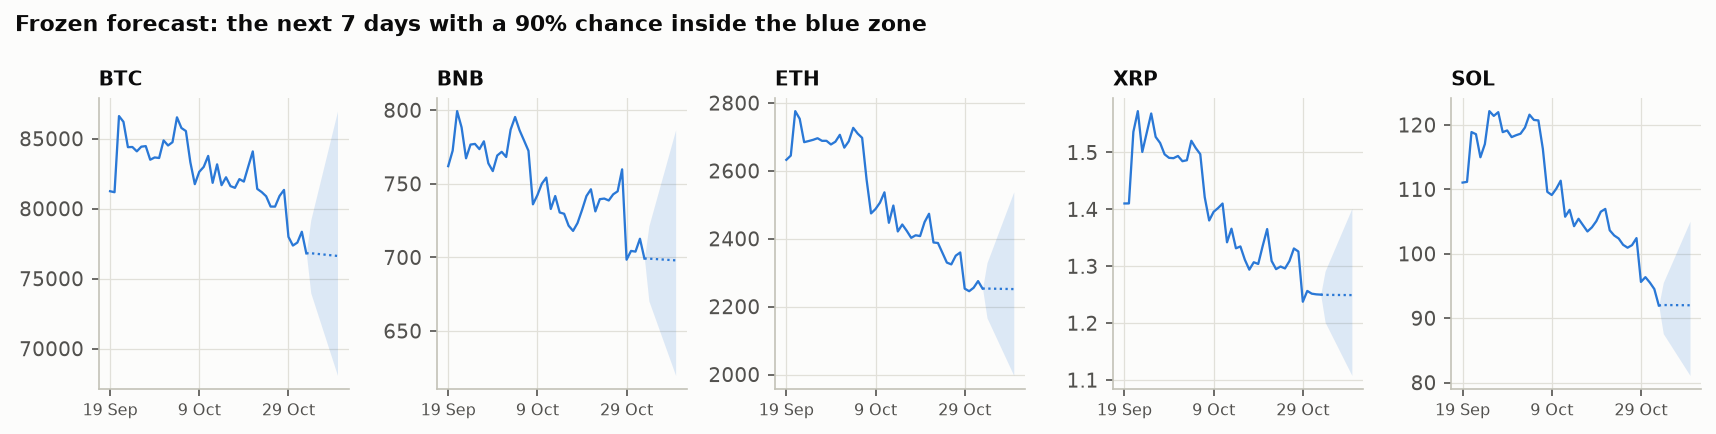
| Coin | Horizon | Date | Last close | 5% | Median | 95% |
|---|---|---|---|---|---|---|
| Moneda | Horizonte | Fecha | Último cierre | 5% | Mediana | 95% |
| BNB | 1d | 2026-11-03 | 699.25 | 670.40 | 699.18 | 721.39 |
| BNB | 7d | 2026-11-09 | 699.25 | 619.80 | 698.01 | 786.69 |
| BTC | 1d | 2026-11-03 | 76,816 | 73,987 | 76,820 | 79,192 |
| BTC | 7d | 2026-11-09 | 76,816 | 68,088 | 76,627 | 86,972 |
| ETH | 1d | 2026-11-03 | 2,253 | 2,167 | 2,253 | 2,329 |
| ETH | 7d | 2026-11-09 | 2,253 | 1,997 | 2,252 | 2,538 |
| SOL | 1d | 2026-11-03 | 91.98 | 87.62 | 92.05 | 95.53 |
| SOL | 7d | 2026-11-09 | 91.98 | 81.12 | 92.02 | 105.07 |
| XRP | 1d | 2026-11-03 | 1.2502 | 1.2016 | 1.2498 | 1.2917 |
| XRP | 7d | 2026-11-09 | 1.2502 | 1.1082 | 1.2494 | 1.4018 |
Cada día GitHub Actions compara este pronóstico congelado del 2026-11-02 con los cierres publicados. Revisado el 2026-11-05: 5 resueltos, 5 dentro de la banda de 90%.
Every day GitHub Actions compares this forecast, frozen on 2026-11-02, with the published closes. Checked 2026-11-05: 5 resolved, 5 inside the 90% band.
| Coin | Horizon | Date | 90% band | Close | Band | Error vs median | Error vs "no change" |
|---|---|---|---|---|---|---|---|
| Moneda | Horizonte | Fecha | Banda 90% | Cierre | Banda | Error contra mediana | Error contra "sin cambio" |
| BNB | 1d | 2026-11-03 | 670.40 - 721.39 | 698.14 (binance) | dentroinside | -0.1% | -0.2% |
| BTC | 1d | 2026-11-03 | 73,987 - 79,192 | 77,454 (binance) | dentroinside | +0.8% | +0.8% |
| ETH | 1d | 2026-11-03 | 2,167 - 2,329 | 2,275 (binance) | dentroinside | +1.0% | +1.0% |
| SOL | 1d | 2026-11-03 | 87.62 - 95.53 | 92.83 (binance) | dentroinside | +0.8% | +0.9% |
| XRP | 1d | 2026-11-03 | 1.2016 - 1.2917 | 1.2767 (binance) | dentroinside | +2.2% | +2.1% |
| BNB | 7d | 2026-11-09 | 619.80 - 786.69 | pendientepending | |||
| BTC | 7d | 2026-11-09 | 68,088 - 86,972 | pendientepending | |||
| ETH | 7d | 2026-11-09 | 1,997 - 2,538 | pendientepending | |||
| SOL | 7d | 2026-11-09 | 81.12 - 105.07 | pendientepending | |||
| XRP | 7d | 2026-11-09 | 1.1082 - 1.4018 | pendientepending |
GlosarioGlossary
- Hot wallet
- billetera conectada a internet con la que el exchange paga retiros.
- wallet connected to the internet that the exchange uses to pay withdrawals.
- Vela
- resume un período: apertura, cierre, máximo y mínimo.
- summarizes a period: open, close, high and low.
- Futuros perpetuos
- contratos para apostar al precio sin comprar la moneda, sin fecha de vencimiento.
- contracts to bet on the price without buying the coin, with no expiry.
- Interés abierto
- total de dinero apostado en futuros en ese momento.
- total money committed in futures at that moment.
- Orden a mercado
- compra o venta apurada, al mejor precio disponible en ese momento.
- a hurried buy or sell, at the best price available right then.
- Mediana
- el valor del medio: la mitad de los casos queda arriba y la mitad abajo.
- the middle value: half the cases are above and half below.
- p
- probabilidad de ver una diferencia así solo por azar; bajo 0.05 se suele considerar clara.
- the chance of seeing such a gap by luck alone; under 0.05 is usually considered clear.
- R²
- qué parte de la variación anticipa un modelo. Negativo: lo hace peor que la referencia.
- what share of the variation a model anticipates. Negative: worse than the benchmark.
- HAR
- modelo simple que anticipa la turbulencia solo con la del último día, semana y mes.
- a simple model that anticipates turbulence using only that of the last day, week and month.
- Banda de 90%
- rango donde debería caer el precio 9 de cada 10 veces.
- the range the price should land in 9 times out of 10.
- Walk-forward
- reentrenar cada período solo con lo conocido hasta entonces, sin mirar el futuro.
- refitting each period on only what was known by then, without looking ahead.
- Época
- una pasada completa de la red neuronal por los datos de entrenamiento.
- one full pass of the neural network over the training data.
- Early stopping
- detener el entrenamiento cuando deja de mejorar sobre datos que no usó para aprender.
- stopping training when it no longer improves on data it did not learn from.