A 0.961 leaderboard that is really a 0.994 model
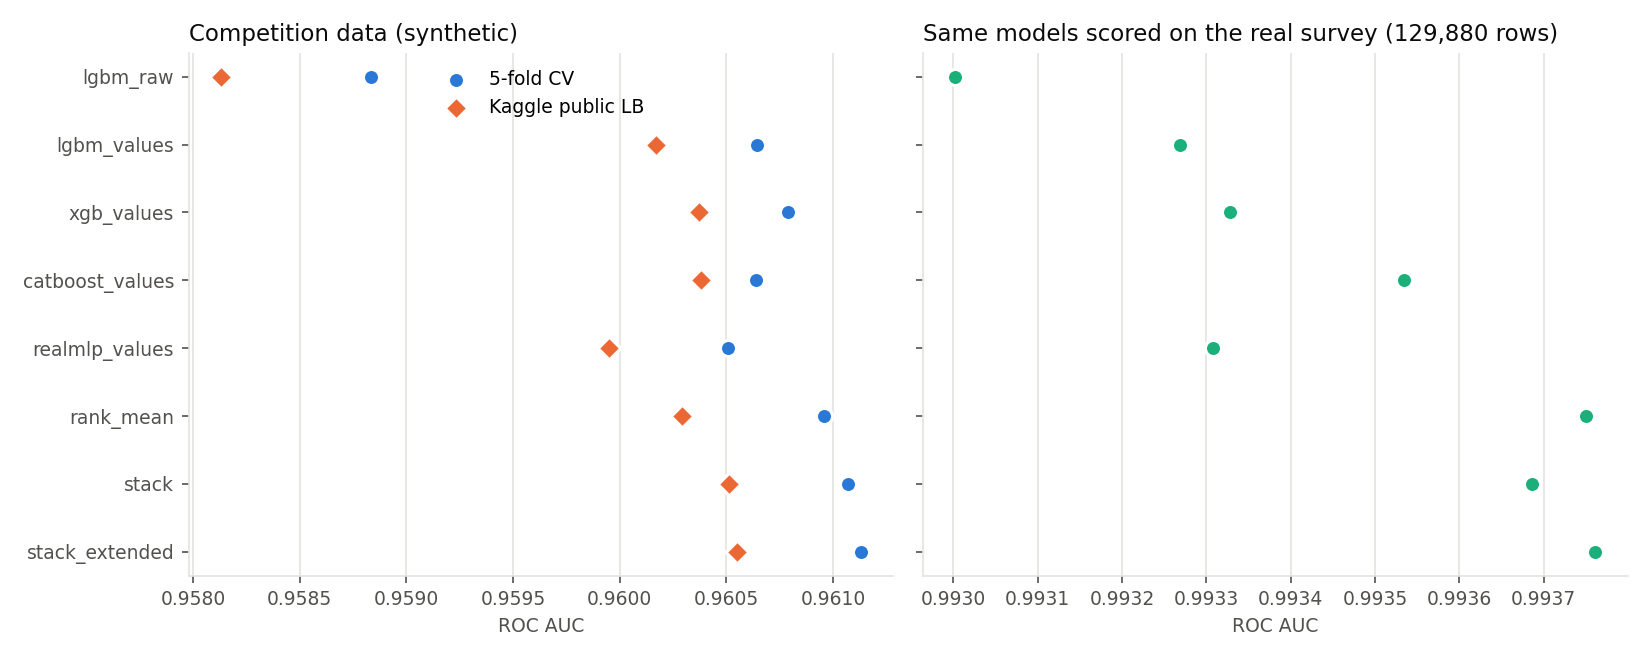
Kaggle Playground S6E10 asks for the probability that an airline passenger is satisfied. Its 1 million rows are synthetic and were generated from a real survey of 129,880 passengers. I scored every competition model on that real survey too. The stack that gets 0.961 on the leaderboard ranks real passengers at 0.994. To push it back down to 0.961, about 3% of the real labels have to be flipped at random. The real survey also shows which popular feature tricks help real passengers and which only exploit the generator.
01Nine submissions, picked on CV
Seven models on one shared 5-fold split, plus three blends. The first seven files were submitted together. RealMLP and the extended stack were picked on CV and submitted together later, so nothing was tuned on the leaderboard. The last column scores the same fold models on the original survey, which they never trained on.
| Submission | 5-fold CV | Kaggle public | Kaggle private | Real survey |
|---|---|---|---|---|
| Logistic regression | 0.92156 | 0.92227 | 0.92162 | 0.92000 |
| LightGBM, raw columns | 0.95884 | 0.95813 | 0.95933 | 0.99300 |
| LightGBM + value features | 0.96064 | 0.96017 | 0.96113 | 0.99327 |
| XGBoost (GPU) + value features | 0.96079 | 0.96037 | 0.96124 | 0.99333 |
| CatBoost (GPU), values as categories | 0.96064* | 0.96038 | 0.96116 | 0.99353 |
| RealMLP (GPU) + value features | 0.96051 | 0.95995 | 0.96092 | 0.99331 |
| Rank mean of the four tree models | 0.96096* | 0.96029 | 0.96126 | 0.99375 |
| Logistic stack of the four tree models | 0.96107* | 0.96051 | 0.96140 | 0.99369 |
| Extended stack (+ RealMLP, + LightGBM with every group) | 0.96113 | 0.96055 | 0.96144 | 0.99376 |
02The labels set the ceiling, not the passengers
A model trained only on synthetic rows ranks the real passengers at 0.9937. A LightGBM trained on the real survey and scored on a held-out 20% of it reaches 0.9950. So the synthetic data still carries the survey's structure. The score is limited by its labels.
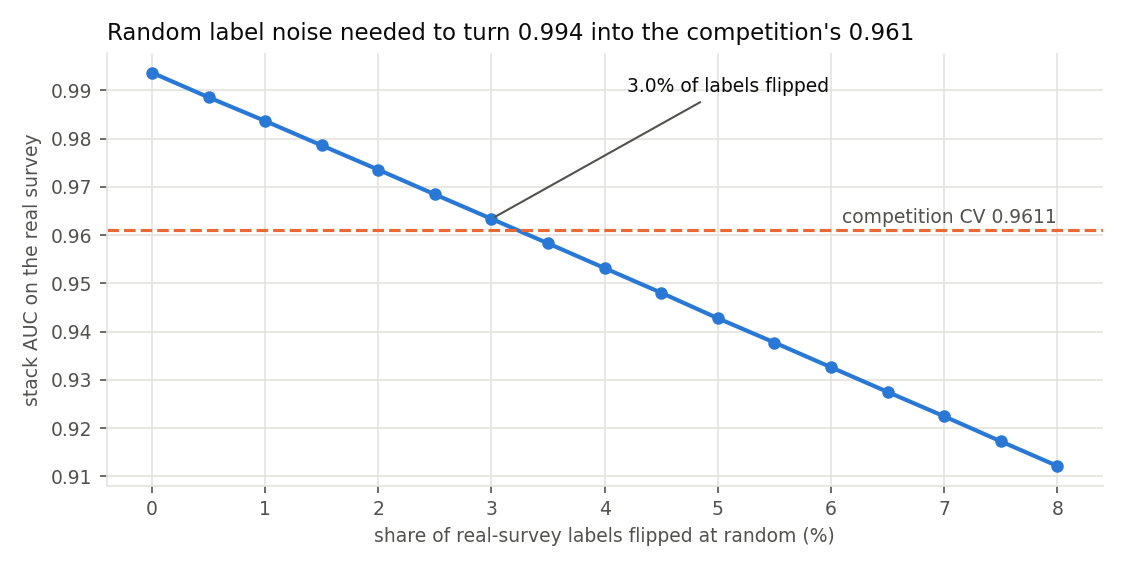
Seen this way, the leaderboard is packed against a noise floor. The leader is 0.0035 above my best submission and the median team 0.0010 below it.
03Which tricks are about passengers?
Public notebooks pile on features: exact values as categories, value counts, the digits of each number, rates from the original survey. I added each group on its own to the raw-column LightGBM, on the same folds, and scored every fold model on both the competition and the real survey. Three configurations were rerun with three more seeds. The seed-to-seed standard deviation is 0.00004 on both scores.
| Feature group added | Gain on CV | Gain on real survey |
|---|---|---|
| Value counts | +0.00067 | +0.00013 |
| Decimal digits of the numbers | +0.00061 | 0.00000 |
| Target encoding of exact values | +0.00128 | −0.00025 |
| Target encoding of values and 210 column pairs | +0.00182 | +0.00018 |
| Satisfaction rates from the real survey | +0.00104 | +0.00024 |
| Counts + both encodings (the value view) | +0.00181 | +0.00027 |
| All of the above | +0.00180 | +0.00013 |
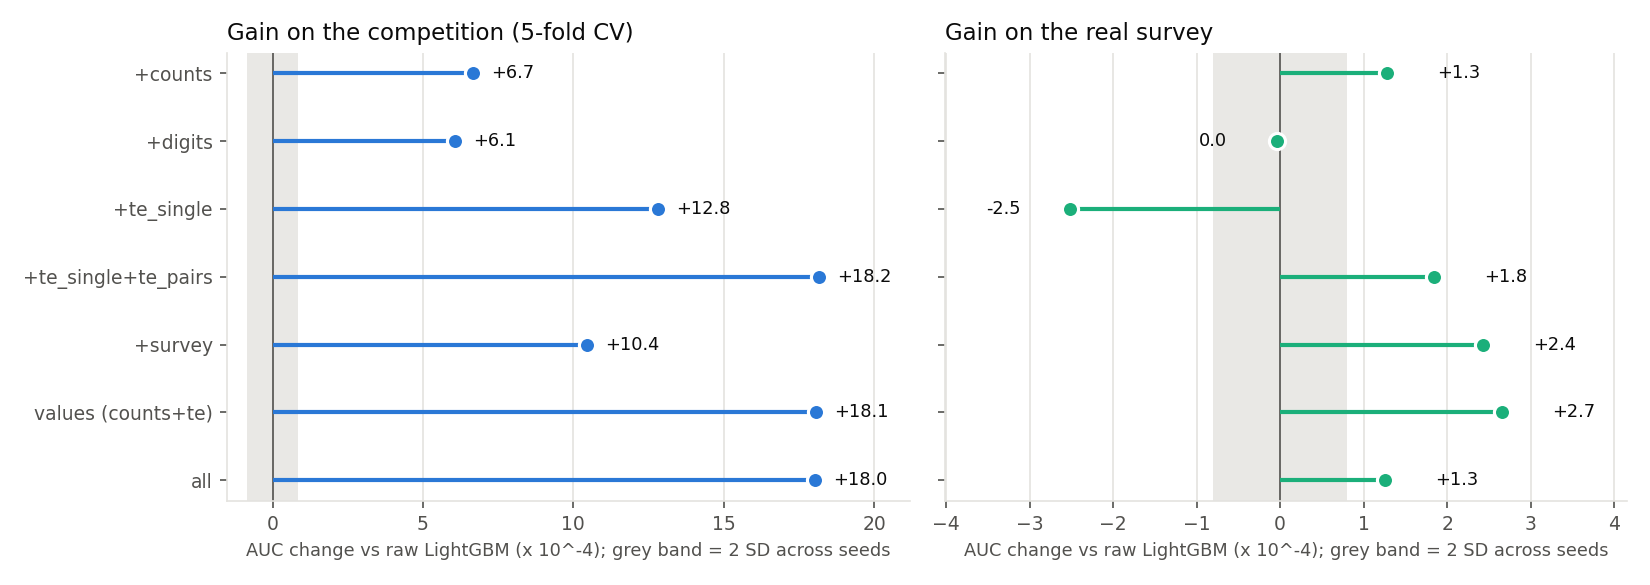
Digits are a pure generator artifact. Averaged over four seeds they add +0.0005 on CV (about 12 seed standard deviations) and −0.00007 on the real survey. Target-encoding exact values on its own hurts real passengers: it is the largest single-group gain on CV, and −0.00027 on the real survey (about 6 standard deviations), because the model learns rates for individual ages and distances that the generator made up. Adding the column pairs turns the real-survey effect positive. Stacking every group ties the value view on CV and does worse on the real survey (0.99313 vs 0.99327). On the leaderboard, both kinds of gain look the same.
04The real survey is not extra training data
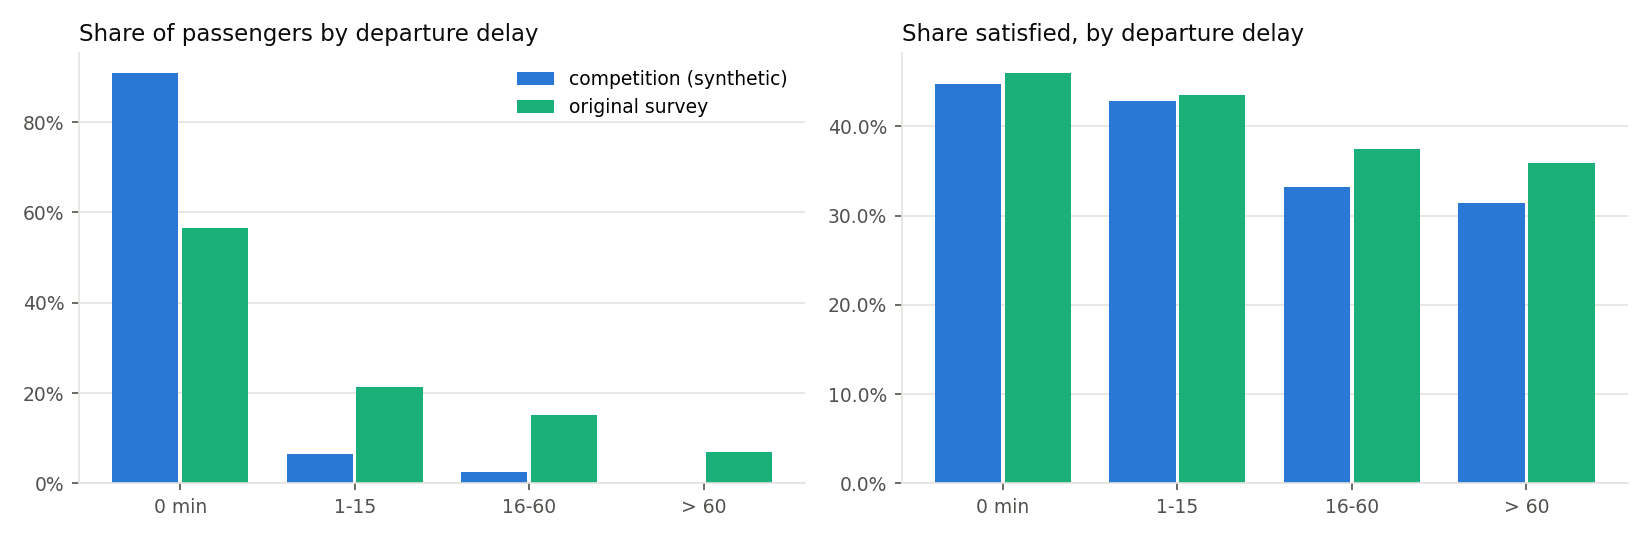
Appending all 129,880 original passengers to every training fold moves CV from 0.95884 to 0.95866. A model trained only on the survey scores 0.9549 on the competition rows. The generator changed the data. 91% of synthetic passengers left on time, against 56% in the survey. The satisfaction drop with delays is steeper, and one rating ("Inflight service") was removed.
05A neural net adds diversity, not score
RealMLP on the value view scores 0.96051 CV, close to the boosted models. Its out-of-fold predictions correlate 0.969-0.974 with the other value models, as low as CatBoost's, so the extended stack splits most of its weight between the two (0.37 and 0.36). The gain is 0.00006 CV and 0.00004 on the leaderboard. Against a noise floor this close, extra models give almost nothing back.
06Caveats
- The label-flip curve is a model of the gap, not proof of how the generator works. Real-survey labels have their own noise, so 0.994 is a ceiling measured against those labels.
- Early stopping watches the validation fold, as is standard for out-of-fold stacking. With 700k rows the optimism is small and the same for every model, and the leaderboard agrees.
- The private leaderboard (released at the close on 2026-10-31) ranks the nine submissions in exactly the CV order; the public one swapped two pairs.